Premium
v1.0
Weather App Dashboard UI
Explore a modern, user-friendly weather dashboard design, featuring city reports, engaging weather videos, and interactive statistics—ideal for digital weather apps.

About Weather App Dashboard UI
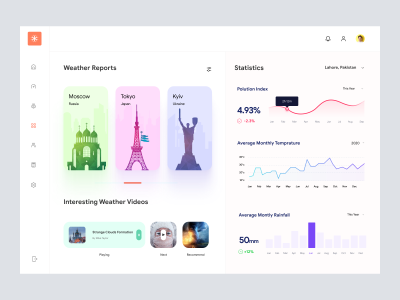
This UI design is a sophisticated and modern weather dashboard, perfect for any digital weather service or application. The layout features a seamless blend of vibrant visual elements and essential data displays, effectively balancing aesthetics with functionality. On the left, an intuitive navigation bar provides access to various dashboard sections with clear, minimalistic icons, ensuring users can navigate effortlessly. The weather reports section showcases major cities with captivating illustrations, allowing users to quickly recognize and jump into detailed weather data. The right side of the layout focuses on statistics, featuring well-organized graphs displaying key metrics such as pollution index, average monthly temperature, and rainfall. The color-coded graphs are easy to interpret, promoting user engagement and interaction. Additionally, the design includes a section for weather-related video content, curated to enhance the user experience with multimedia elements. All components are fully customizable via the Figma file format, providing designers with the flexibility to adapt the design to their brand's specific needs.
Features
- Customizable
- Interactive Elements
- Vibrant Design
- Informative Layout
- Figma Compatible
- Versatile Usage
- User-Friendly
- Multimedia Integration
Frequently Asked Questions
What file format is provided?
The design is available in Figma file format.
Can I customize this design?
Yes, you can fully customize the design elements in Figma.
Is this design mobile responsive?
While the design shown is for desktop, it can be adapted for mobile layouts.
Are the icons included in the file?
Yes, all icons seen in the design are included.
What kind of statistics are displayed?
The dashboard displays pollution index, temperature, and rainfall statistics.
How is the multimedia content integrated?
The design includes a section for weather-related videos for added engagement.
Can I change the color scheme?
Yes, the color scheme is easily adjustable in Figma.
How do I implement this design into my website?
Design elements can be copied directly into your Figma project for smooth integration.
Is user interaction supported in this design?
The design prioritizes user interaction with clickable elements and interactive graphs.
Can I update the cities displayed?
Yes, you can modify the cities and associated data as needed.
Premium License
Unknown Size
More like this
View all
Cryptocurrency Dashboard UI Concept 4
881
U
UI Dux

Ecommerce Store Dashboard
418
U
UI Dux

Cryptocurrency Dashboard UI Concept
554
U
UI Dux
Figma
XD
Project Management Dashboard UI
955
U
UI Dux
Figma
XD
Free
Dashboard Top Nav
770
U
UI Dux

Freelancer Personal Investment Dashboard UI
897
U
UI Dux
Figma
XD
Atom - Finance App Dashboard UI Template
473
U
UI Dux
Figma
XD
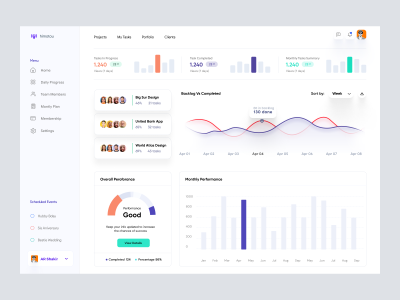
Project Management Dashboard
375
U
UI Dux
Figma
XD
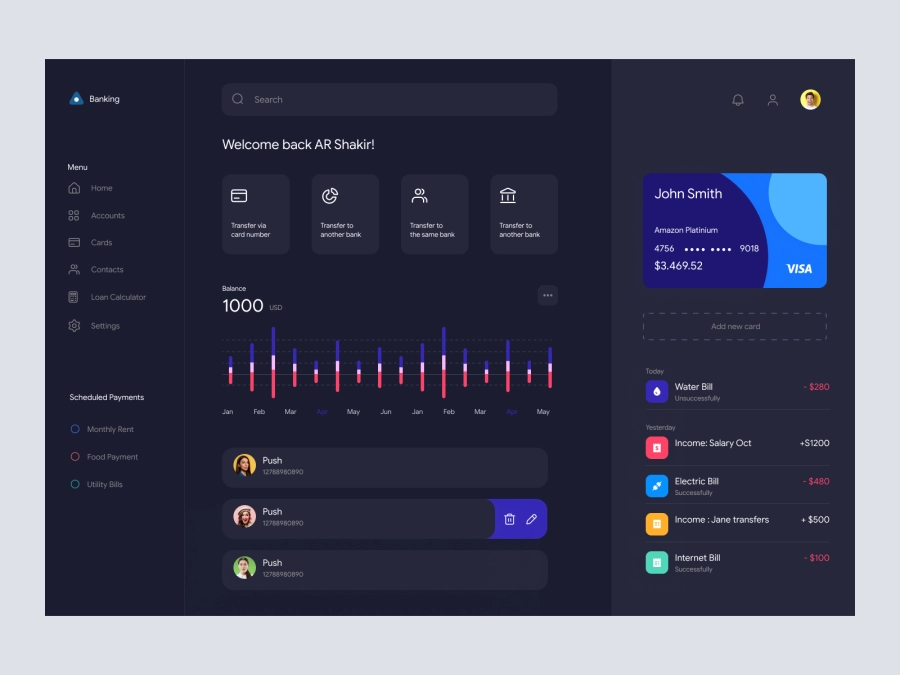
PixelPay - Banking Dashboard UI Dark Version
323
U
UI Dux
Figma
XD
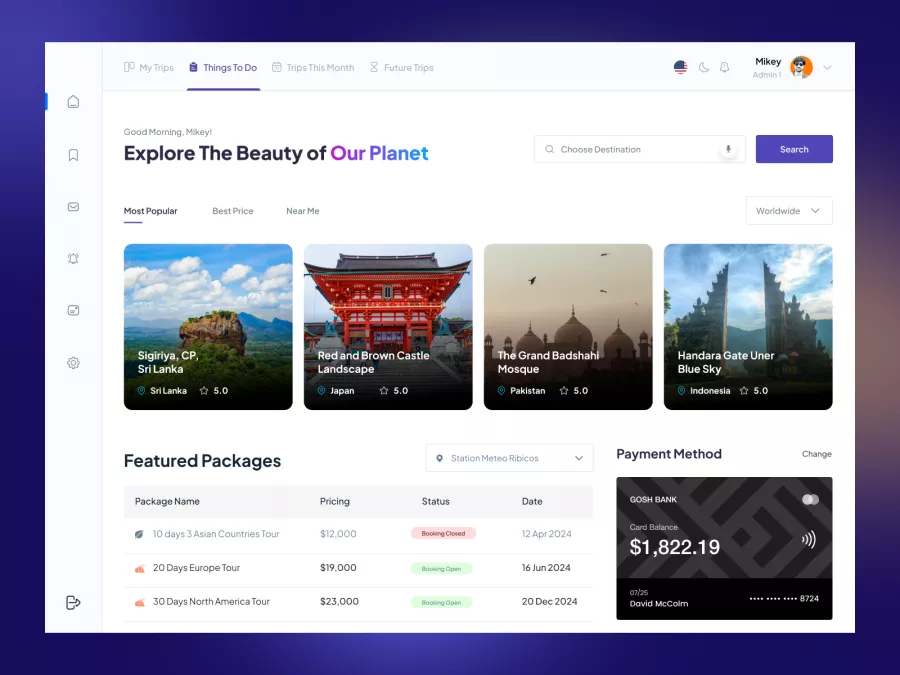
Zaini - Trips and Travel Company Dashboard UI
261
U
UI Dux
Figma
XD
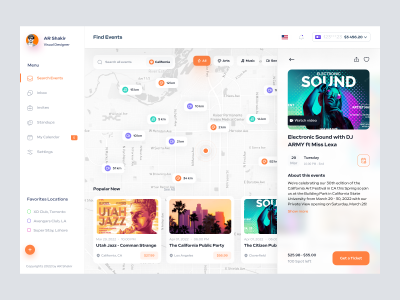
Event Finder Dashboard
767
U
UI Dux
Figma
XD
Free
Dashboard Sidebar Navigation
864
U
UI Dux
Finance app ui
842
U
UI Dux
Figma
XD
BitBridges - Finance Dashboard Clean UI - Dark Version
781
U
UI Dux
Figma
XD
Free
Dashboard Top Nav
866
U
UI Dux