Premium
v1.0
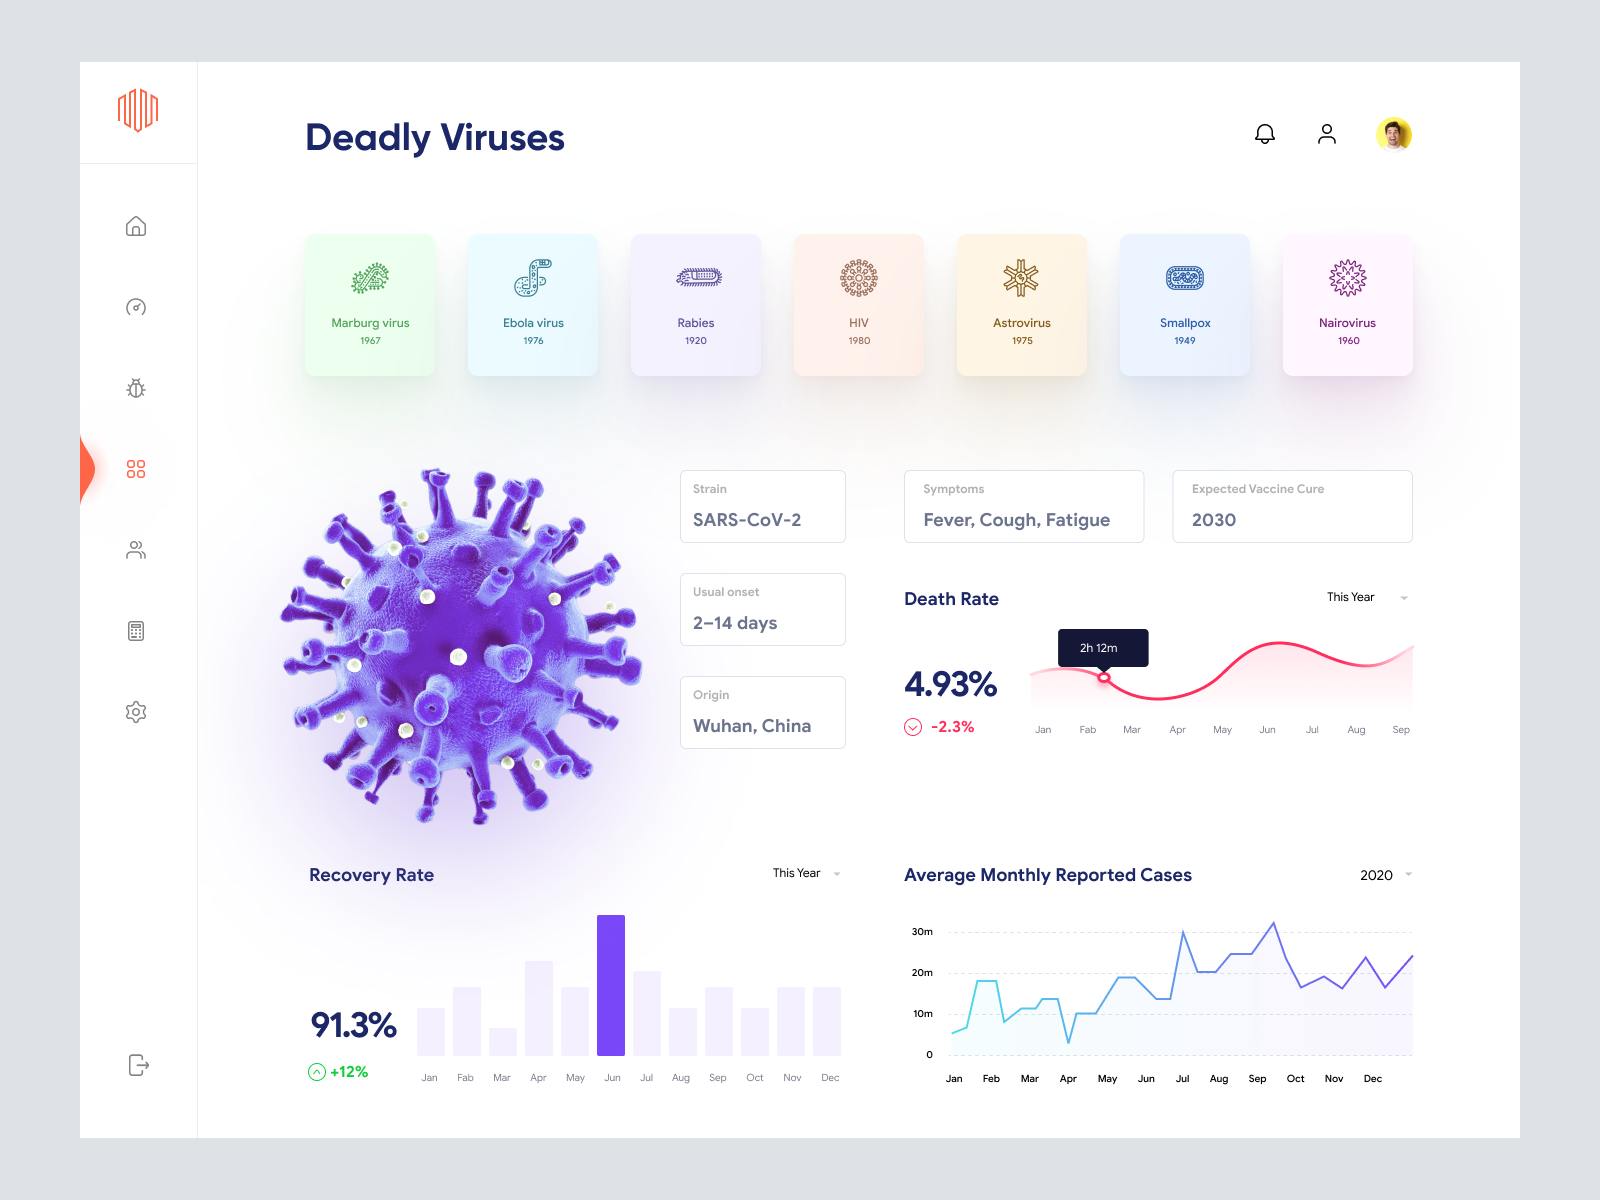
Viruses Information Dashboard UI
Innovative UI design offering a clean, interactive dashboard for health data, ideal for informational platforms. Effortlessly implementable and visually engaging.

About Viruses Information Dashboard UI
Explore an innovative and visually striking UI design perfect for health and data-centric applications. This meticulously crafted design presents a clean and insightful overview of viral statistics, complete with an engaging and interactive dashboard. Users can easily navigate through data points like recovery rates, death rates, virus details, and symptom timeliness, all intuitively organized within an aesthetically pleasing interface. Leveraging pastel color schemes and modern typography, this UI offers seamless user experience, crucial for medical or informational platforms. The design integrates dynamic graphical elements such as line charts, bar graphs, and cards, ensuring vital information is both accessible and engaging. Ideal for developers and designers looking to enhance their projects with a sleek, professional touch, this Figma file is straightforward to implement, allowing for immediate use without any cumbersome downloads.
Features
- Elegant Design
- Data Visualization
- Customizable
- User-Friendly
- Figma Integration
- Real-Time Ready
- Responsive Layout
- Professional Quality
Frequently Asked Questions
What file format is this design available in?
The design is available in a Figma file format.
Can I edit the design directly in Figma?
Yes, you can copy and paste the design directly into Figma for editing.
Is it suitable for mobile interfaces?
The design is currently optimized for web, but can be adapted for mobile apps.
Does the design include interactive elements?
Yes, it includes interactive components like graphs and charts.
Can I change the color scheme?
Yes, the color scheme is fully customizable in Figma.
Is the typography customizable?
Absolutely, you can modify typography styles to fit your brand.
What kind of data visualization options are included?
The design includes line charts, bar graphs, and infographic cards.
Is this design suitable for real-time data updates?
Yes, it is structured to support real-time data integration.
How can this design enhance my project?
It offers a professional and modern interface ideal for health information systems.
Is there support available if I encounter issues?
Support is available for any queries or issues regarding implementation.
Premium License
Unknown Size
More like this
View all
Cryptocurrency Dashboard UI Concept 4
799
U
UI Dux
Free
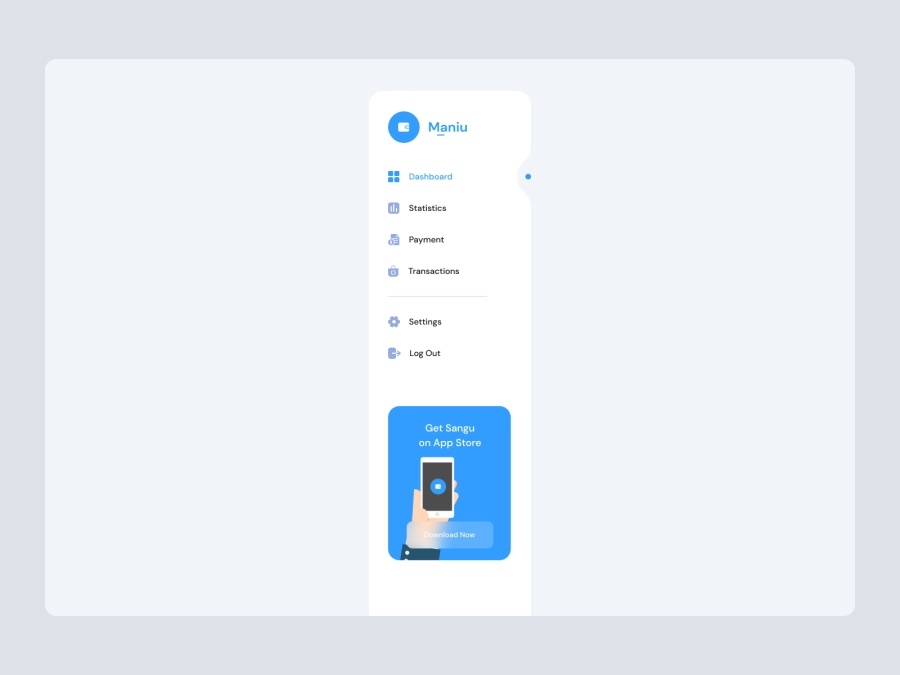
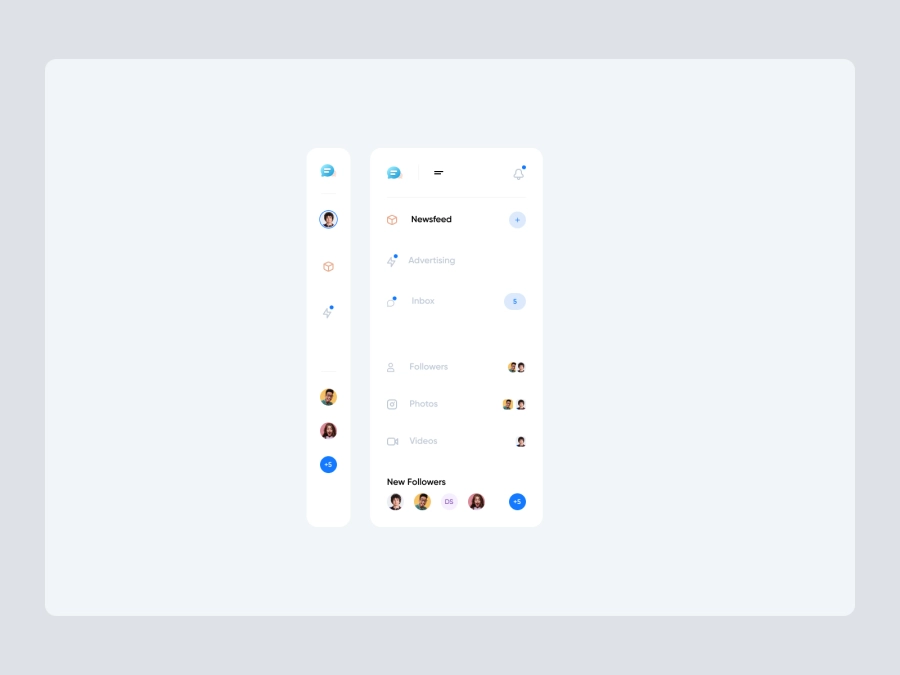
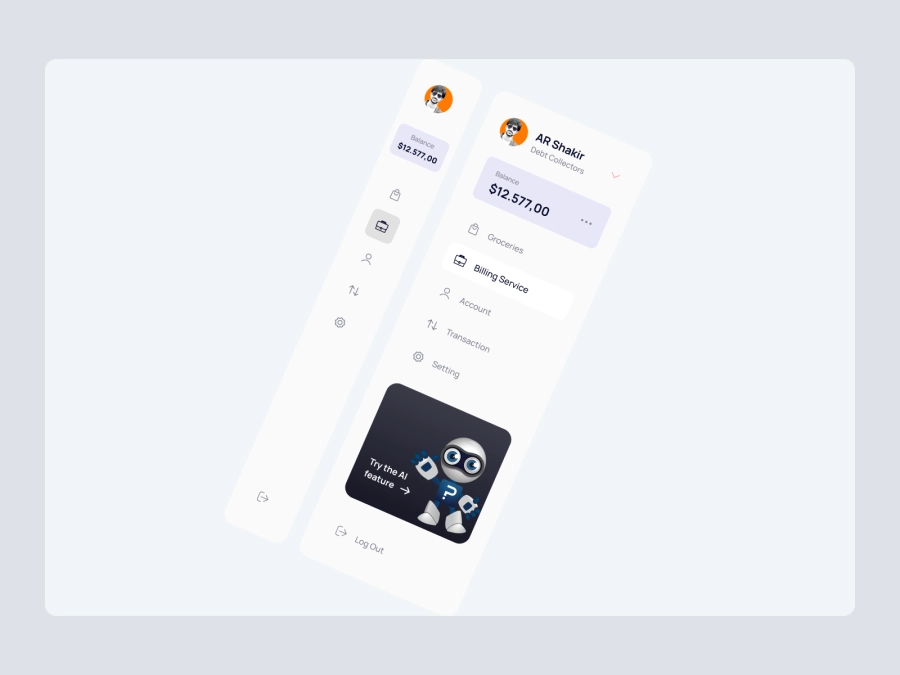
Dashboard Sidebar Navigation
841
U
UI Dux
Ecommerece Dashboard UI Concept
148
U
UI Dux
Figma
XD
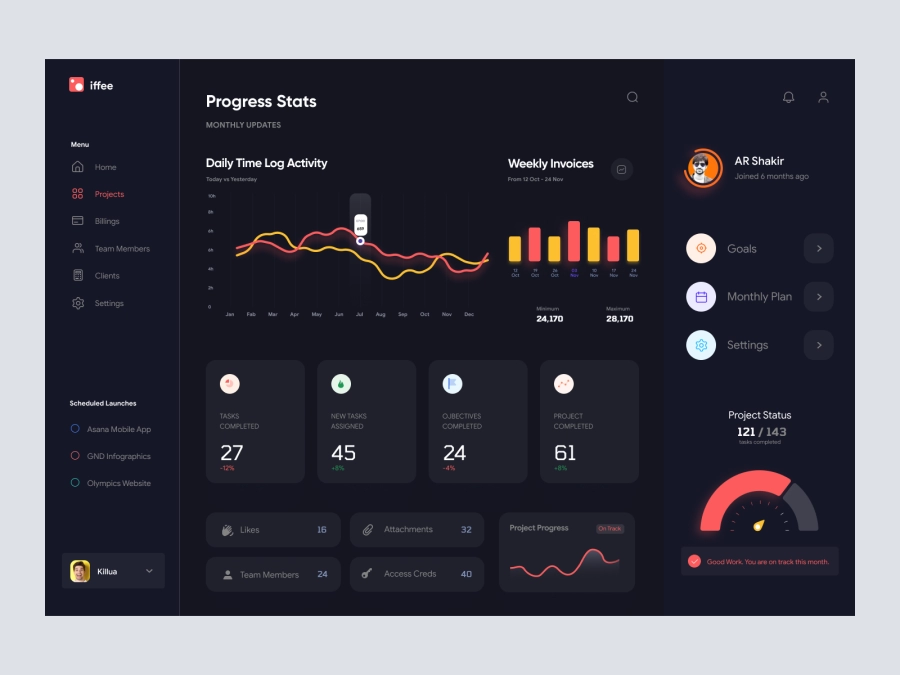
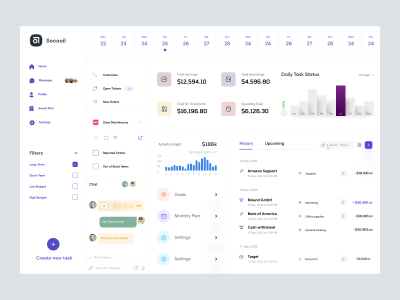
iFFee - Project Management Dashboard UI
565
U
UI Dux
Figma
XD
Project Management App Concept
752
U
UI Dux
Figma
XD
Free
Dashboard Sidebar Navigation
142
U
UI Dux
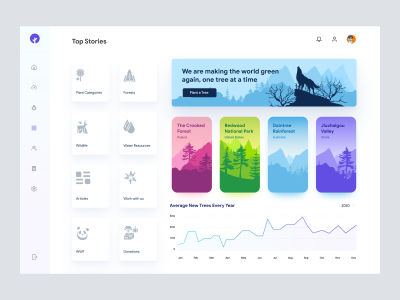
Save The Jungles - Dashboard UI Concept
269
U
UI Dux

Sleek Dashboard Design for Data Management
470
U
UI Dux
Figma
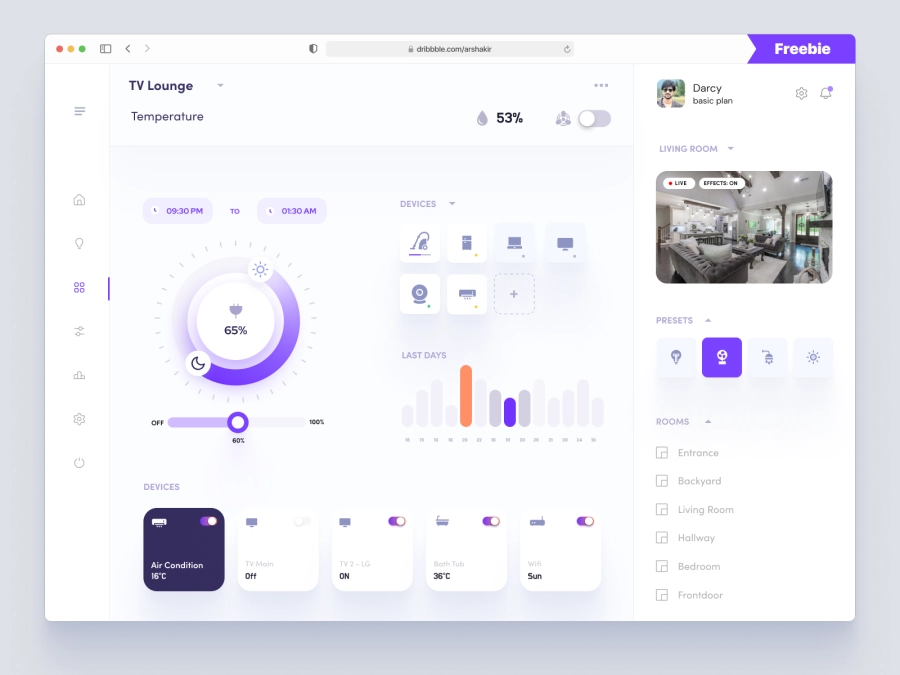
Darcy - Smart Home Management Dashboard
748
U
UI Dux
Figma
XD
Free
Dashboard Sidebar Navigation
290
U
UI Dux

06 - Cryptocurrency Dashboard UI Concept
636
U
UI Dux
Walleta - Digital Wallat Web App Dashboard
472
U
UI Dux
Figma
XD
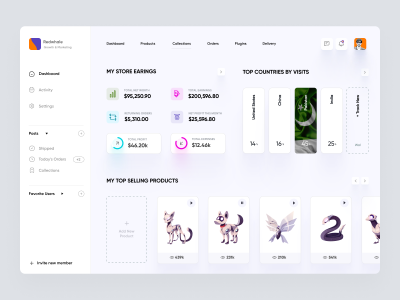
Ecommernce Store Dashboard UI
927
U
UI Dux

Finance Dashboard Clean UI
827
U
UI Dux
Figma
XD

Cryptocurrency Dashboard UI Concept
848
U
UI Dux
Figma
XD