Premium
v1.0
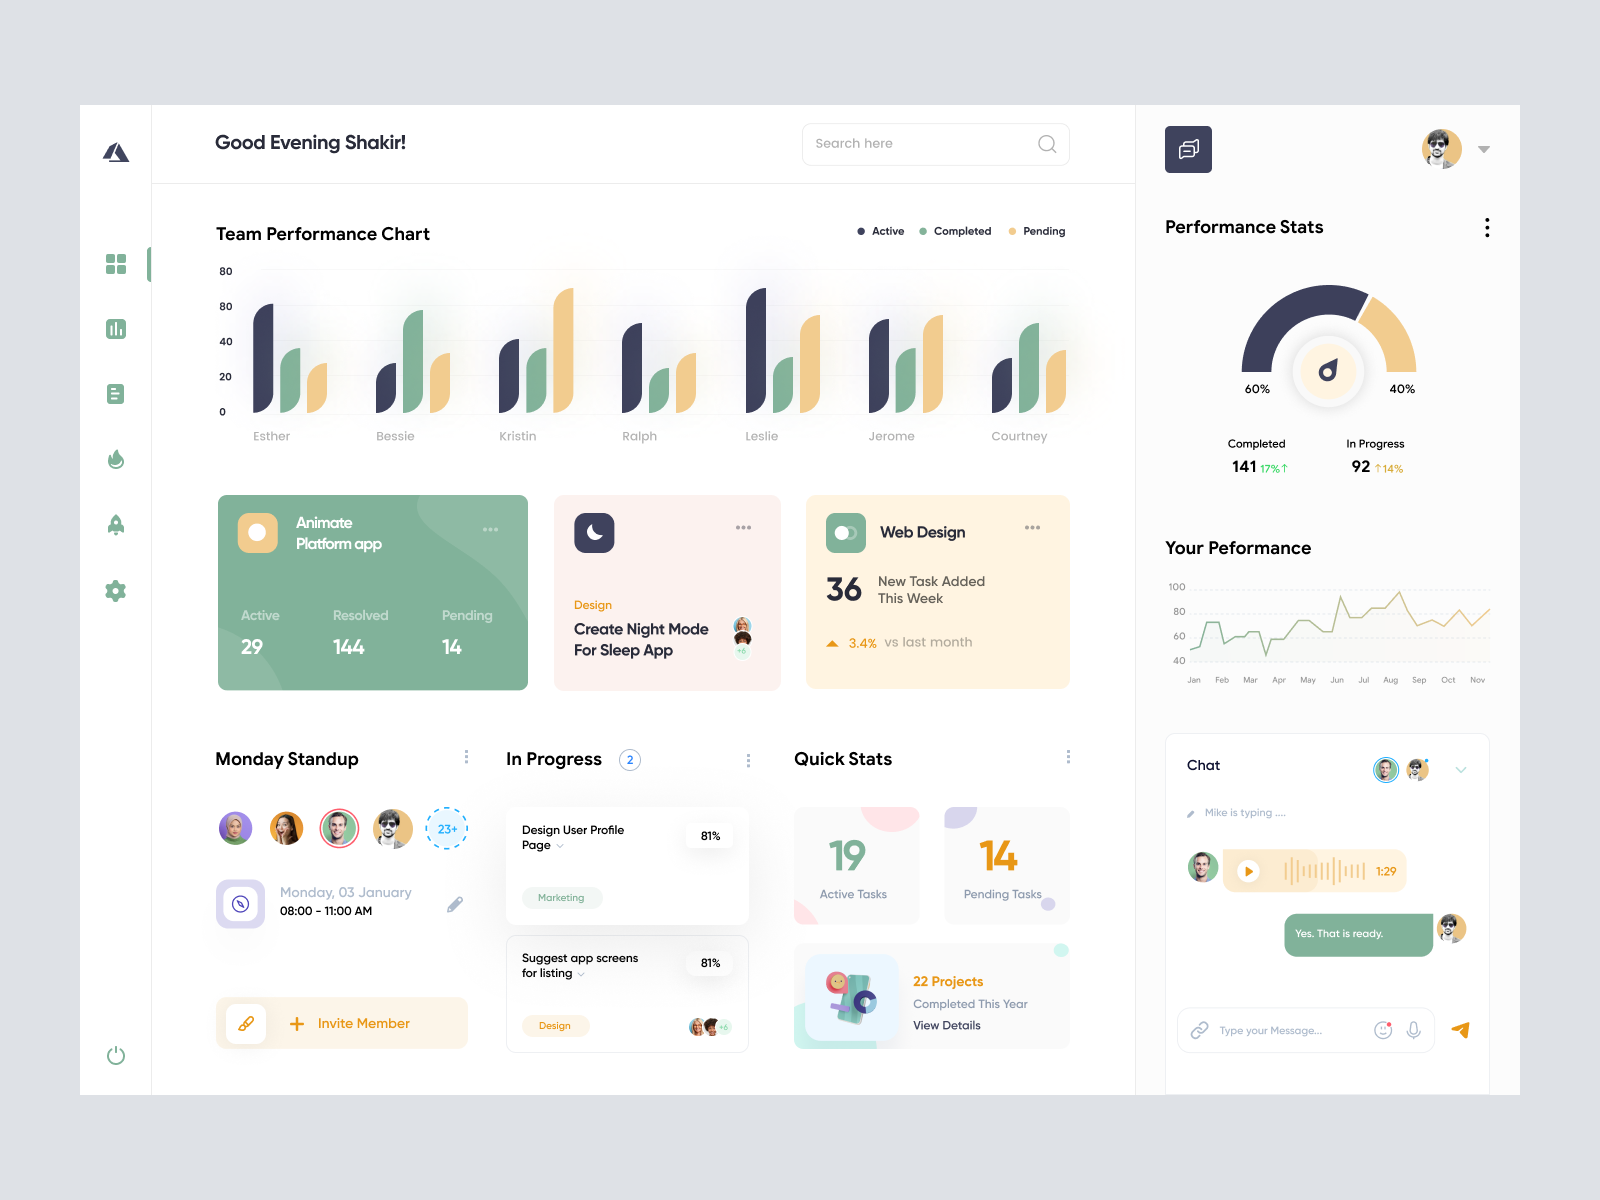
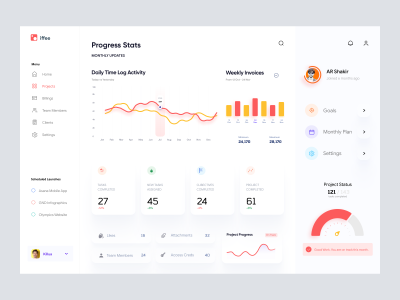
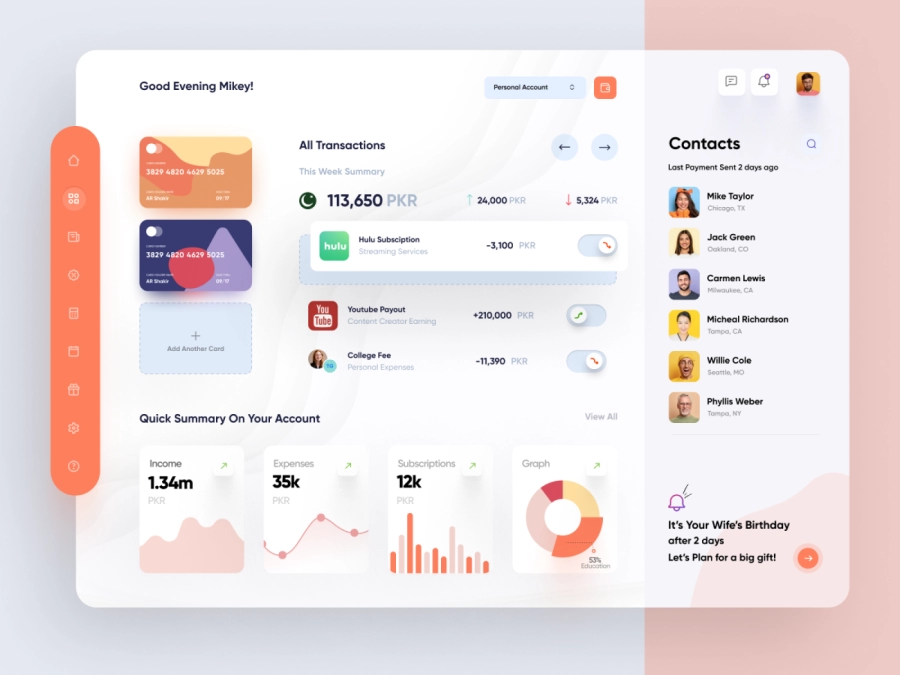
Project Management Dashboard UI Concept
Streamline your performance tracking with this modern UI dashboard design. Easily integrate with Figma, featuring intuitive graphs, performance stats, and collaborative tools.

About Project Management Dashboard UI Concept
Introducing a sleek and modern UI design tailored for performance tracking applications. This design presents an elegant dashboard layout that combines intuitive navigation with aesthetic appeal. The dashboard includes a team performance chart that visually represents data through vibrant bar graphs, allowing for quick interpretation and analysis. On the right, users can find a performance stats section, complete with comprehensive metrics presented in a clean, circular graph format. The layout also features cards that display active projects, pending tasks, and recent achievements, ensuring users have quick access to essential information. With an integrated chat functionality, users can collaborate seamlessly. This Figma file is designed for seamless integration, allowing designers to easily copy and paste directly into their projects without the need for downloading. Ideal for designers looking to enhance user engagement and streamline task management, this design balances functionality with visual delight.
Features
- Ready for Figma
- Data Visualization
- Collaborative Tools
- Customizable Design
- User-Friendly Interface
- Comprehensive Performance Stats
- Streamlined Task Management
- Modern Aesthetics
Frequently Asked Questions
What is the file format?
The file is in Figma format for easy integration.
Can I copy and paste elements?
Yes, you can copy and paste directly into your Figma project.
Does this design include a chat feature?
Yes, it includes a built-in chat section for collaboration.
Are performance stats included?
Yes, it features detailed performance stats with graphs.
Is this design responsive?
The design is primarily for desktop use but can be adapted for responsiveness.
How are tasks displayed?
Tasks are shown in cards that display active, pending, and completed states.
Can I customize the colors?
Yes, you can customize colors directly in Figma.
Is the design suitable for team management?
Absolutely, it's great for team performance tracking and management.
Does it have a search feature?
Yes, a search bar is included for easy navigation.
How is data visually represented?
Data is shown through bar graphs and circular charts for clear analysis.
Premium License
Unknown Size
More like this
View all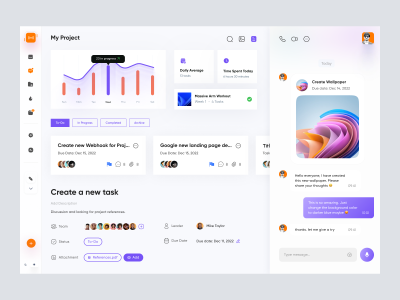
Project Managment App Dashboard UI
998
U
UI Dux
Figma
XD
Cryptocurrency Dashboard UI
739
U
UI Dux
Figma
XD
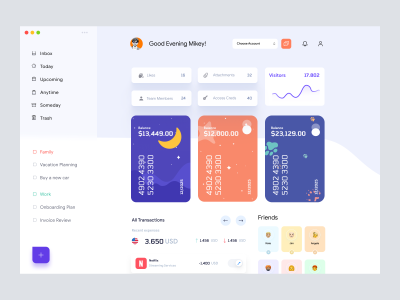
Walleta - Digital Wallat Web App Dashboard
289
U
UI Dux
Figma
XD
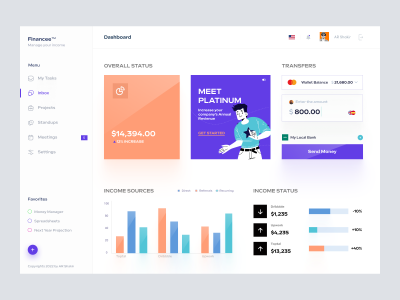
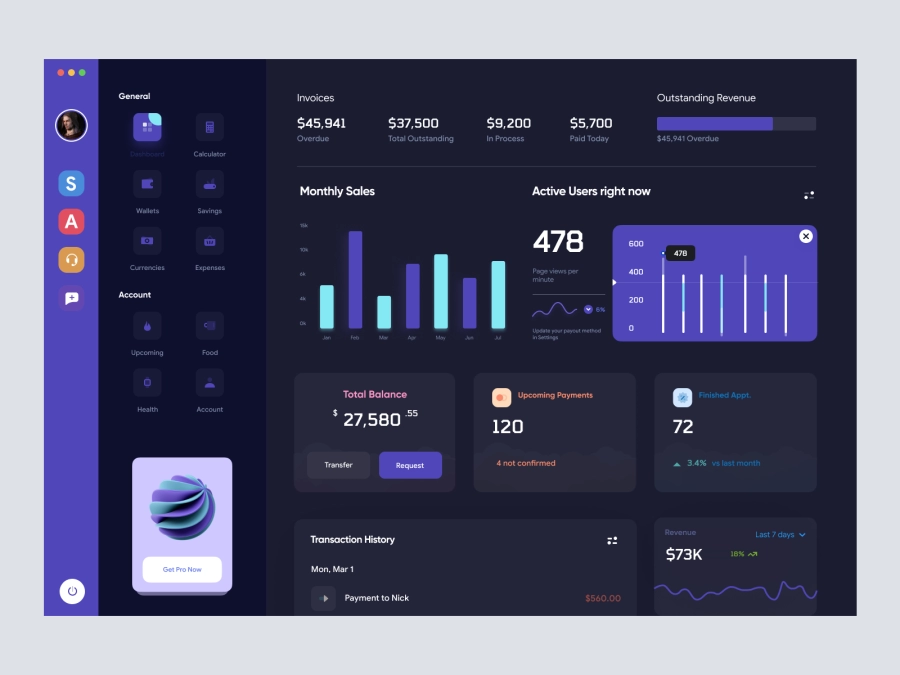
Freelancer Finance Dashboard
136
U
UI Dux
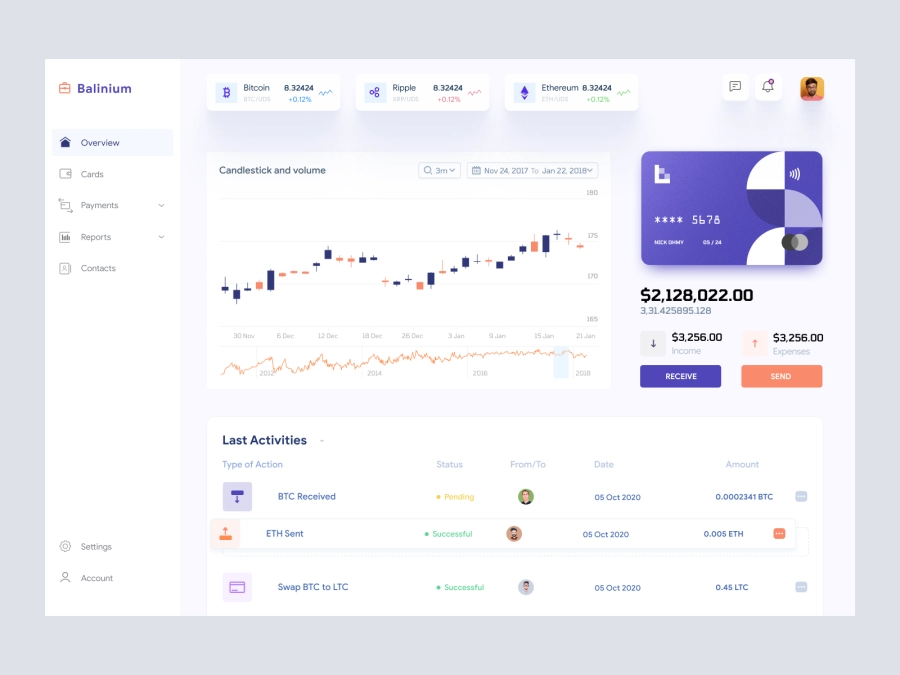
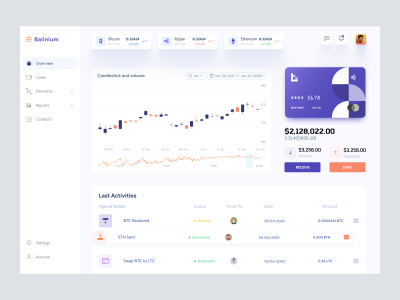
Balinium - Cryptocurrency Dashboard UI
212
U
UI Dux
Figma
XD
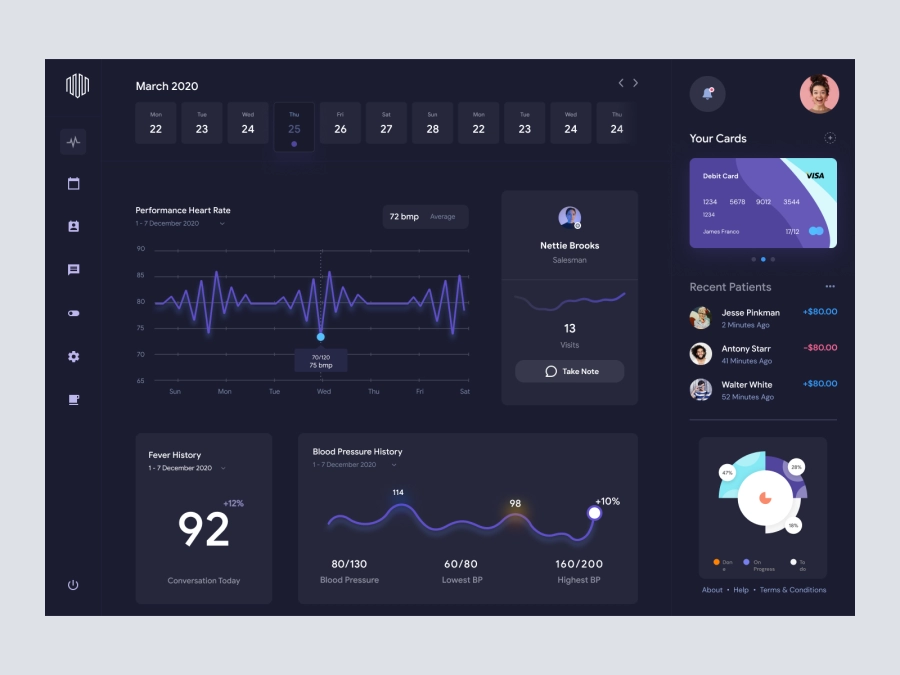
Dr.Du - Doctors Dashboard
337
U
UI Dux
Figma
XD

VitalHealth Dashboard UI for Health Management
485
U
UI Dux
Figma
Project Management Dashboard UI
241
U
UI Dux
Figma
XD
Free
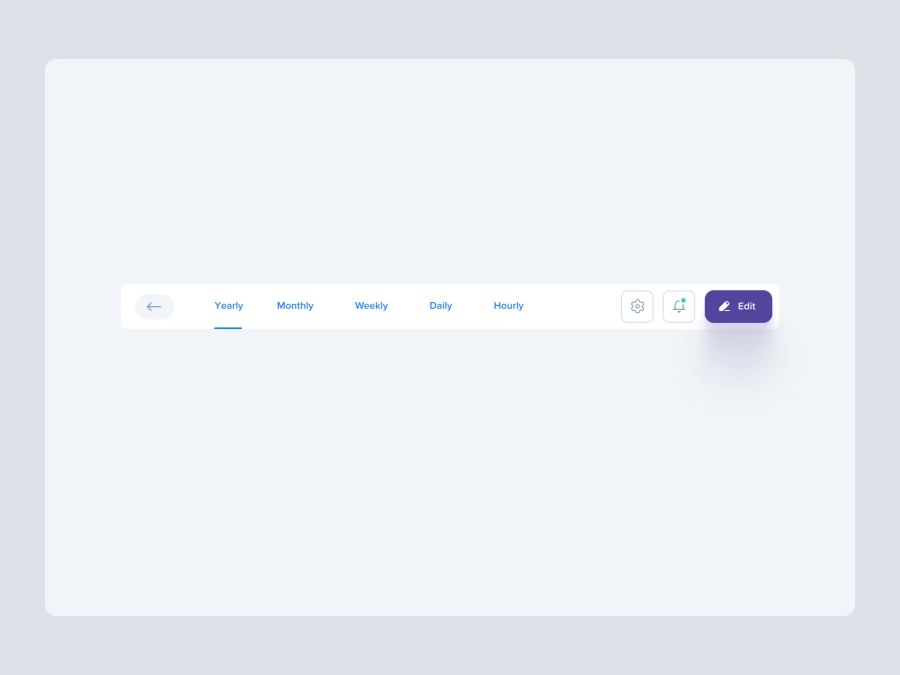
Dashboard Top Nav
158
U
UI Dux
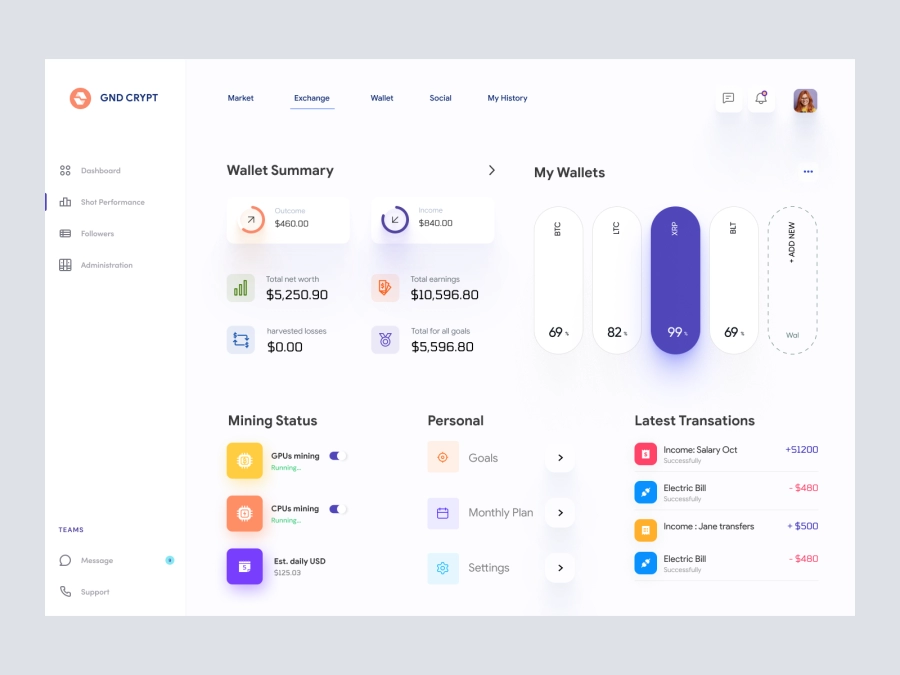
GND CRYPT - Cryptocurrency Dashboard UI
425
U
UI Dux
Figma
XD
RW - Cryptocurrency Dashboard UI
322
U
UI Dux
Figma
XD

Weather App UI Concept
713
U
UI Dux
Figma
XD
Banking Dashboard UI
272
U
UI Dux
Xoya - FInance App Dashboard UI Template
291
U
UI Dux
Figma
XD

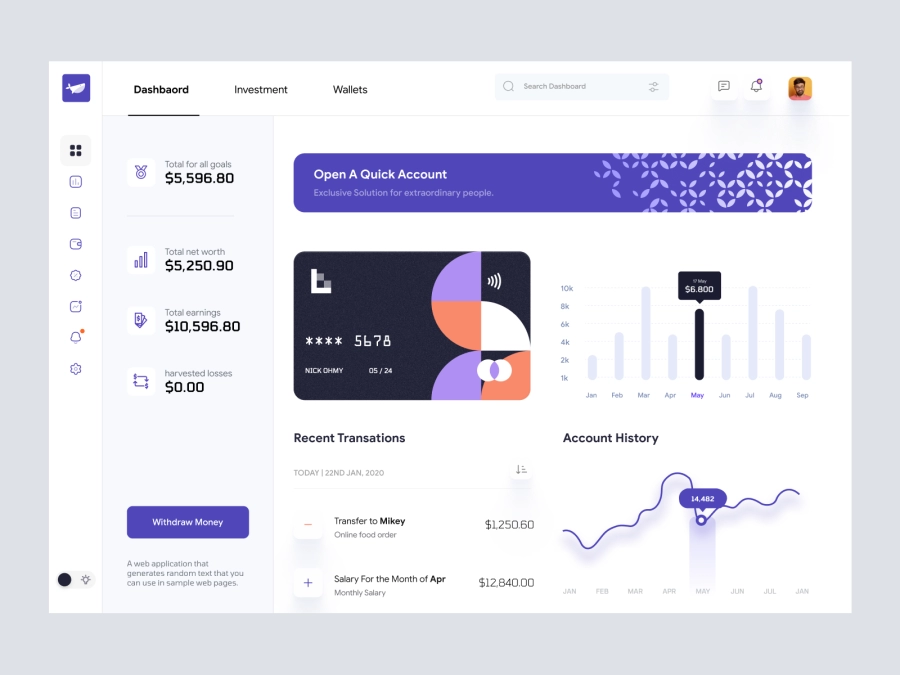
Fintech app Dashboard UI
909
U
UI Dux
Figma
XD