Premium
v1.0
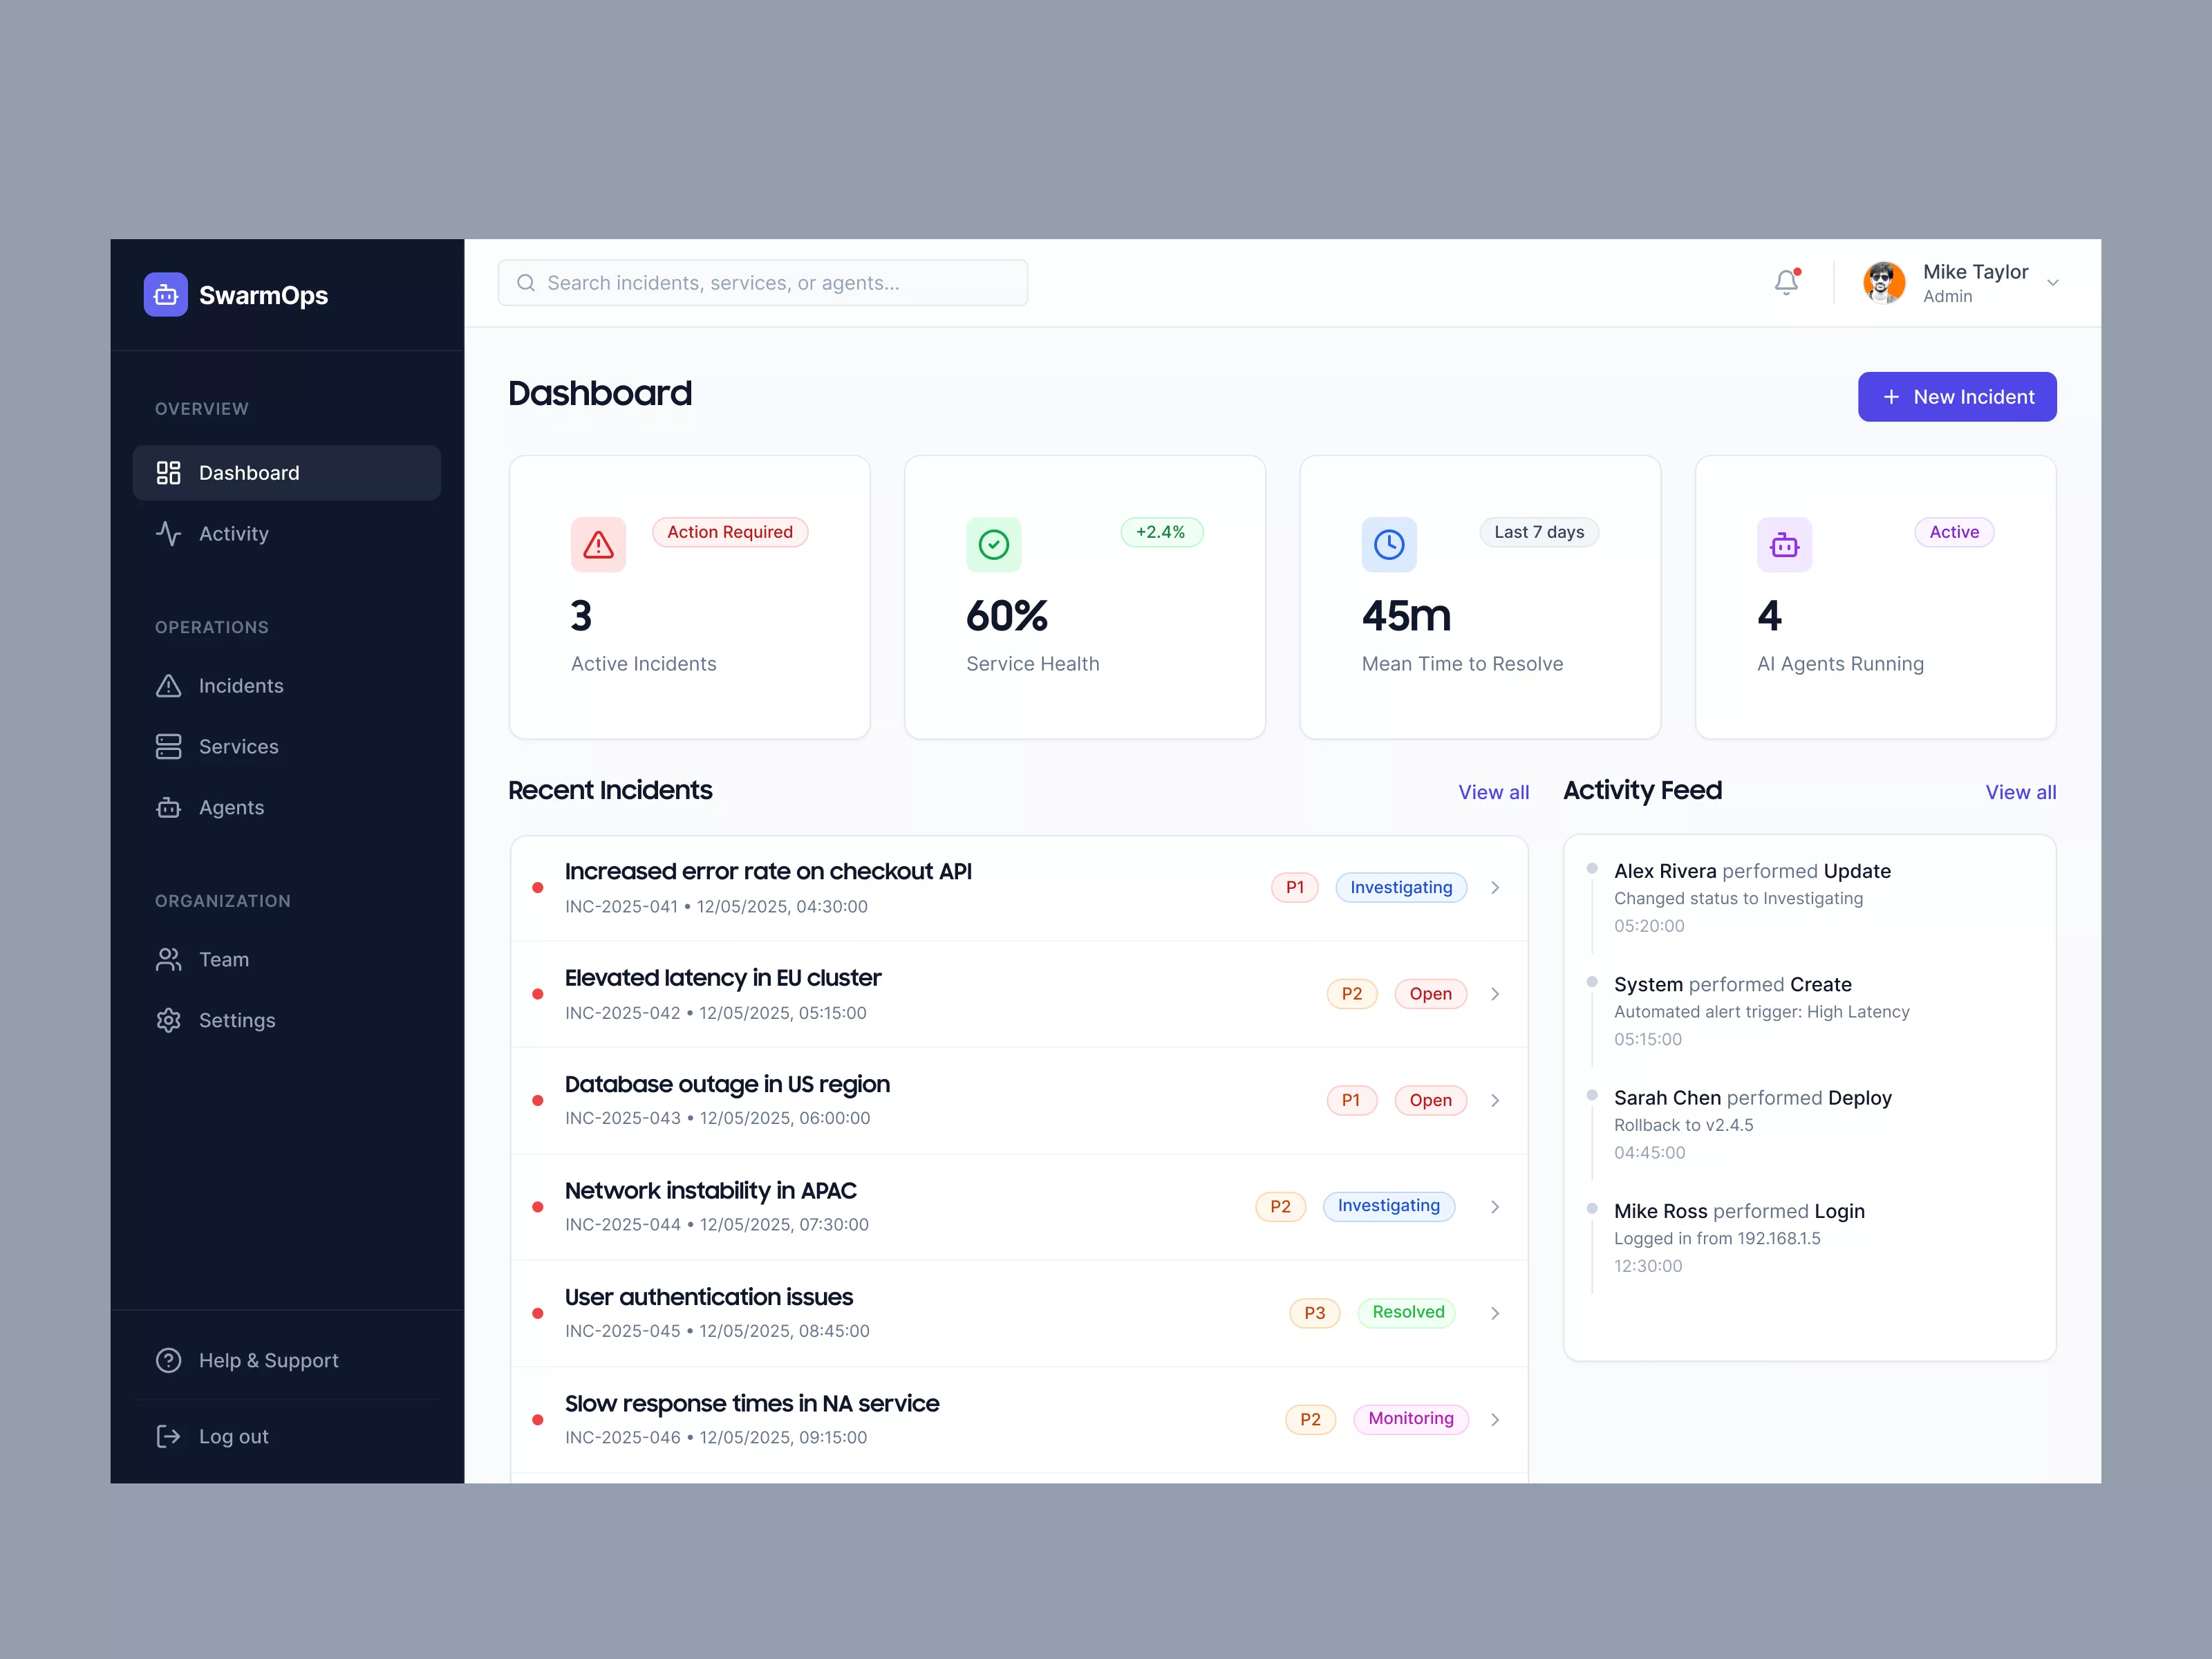
Sleek Incident Management Dashboard UI
This UI design is a detailed incident management dashboard featuring intuitive navigation, critical metrics display, recent incidents, and activity feed for efficient operations.

About Sleek Incident Management Dashboard UI
The UI design presents a sleek and organized operational dashboard tailored for incident management. The left sidebar offers intuitive navigation, categorically showcasing sections such as Dashboard, Activity, Incidents, Services, and Agents. This facilitates a streamlined process for users aiming to manage operations effectively. Highlighted is the key dashboard area displaying critical metrics: active incidents, service health, mean time to resolve, and the number of AI agents running. This quick overview helps administrators address issues promptly. A prominent 'New Incident' button allows users to add incidents quickly, enhancing responsiveness. Recent incidents are vividly listed with urgency indicators and status tags like 'Investigating' and 'Open', ensuring priority management. Adjacent to this, the activity feed displays recent actions in chronological order, offering a transparent operational history. User interaction components are carefully placed, with a search bar at the top for quick access and a user profile icon for settings. Overall, the design emphasizes clarity, efficiency, and user-centered functionality, making it an invaluable tool for tech-focused teams.
Features
- User-Friendly Navigation
- Real-Time Updates
- Priority Management
- Activity Transparency
- Responsive Design
- Centralized Incident Reporting
- Customizable Metrics
- Efficient Search Functionality
Frequently Asked Questions
What is the main functionality of this dashboard?
The dashboard is designed for incident management, providing quick access to key metrics and recent activity.
Can I add a new incident from this interface?
Yes, the 'New Incident' button allows you to quickly add and manage new incidents.
How is the service health represented?
Service health is displayed as a percentage, indicating the current system performance.
What does the 'Mean Time to Resolve' metric show?
It shows the average time taken to resolve incidents over the past 7 days.
Can I view detailed activity logs?
Yes, the activity feed keeps a chronological record of recent actions and changes.
How are incidents categorized by priority?
Incidents are marked with priority labels such as P1, P2, indicating their urgency level.
Is there a search functionality?
Yes, a search bar at the top allows users to find specific incidents, services, or agents quickly.
Can I customize which metrics are shown on the dashboard?
Customization options exist depending on user permissions and settings.
What information is in the 'Recent Incidents' section?
It lists incidents with a brief description, date, time, and current status.
How do I check agent statuses?
The dashboard provides an 'AI Agents Running' metric, showing active agent numbers.
Premium License
Unknown Size
More like this
View all
Dribbble Pro Dashboard UI Concept
755
U
UI Dux
Free
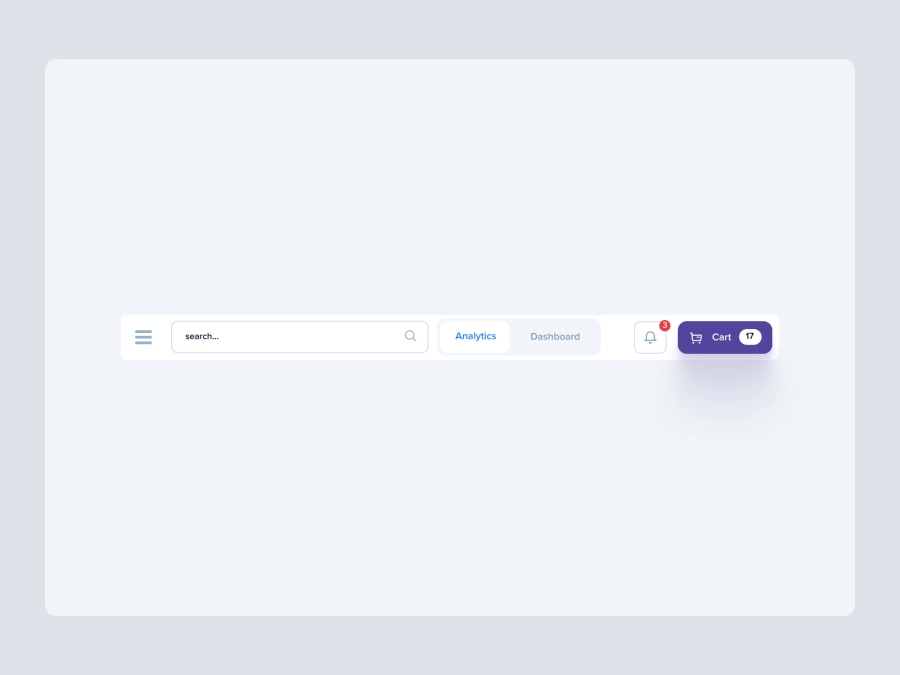
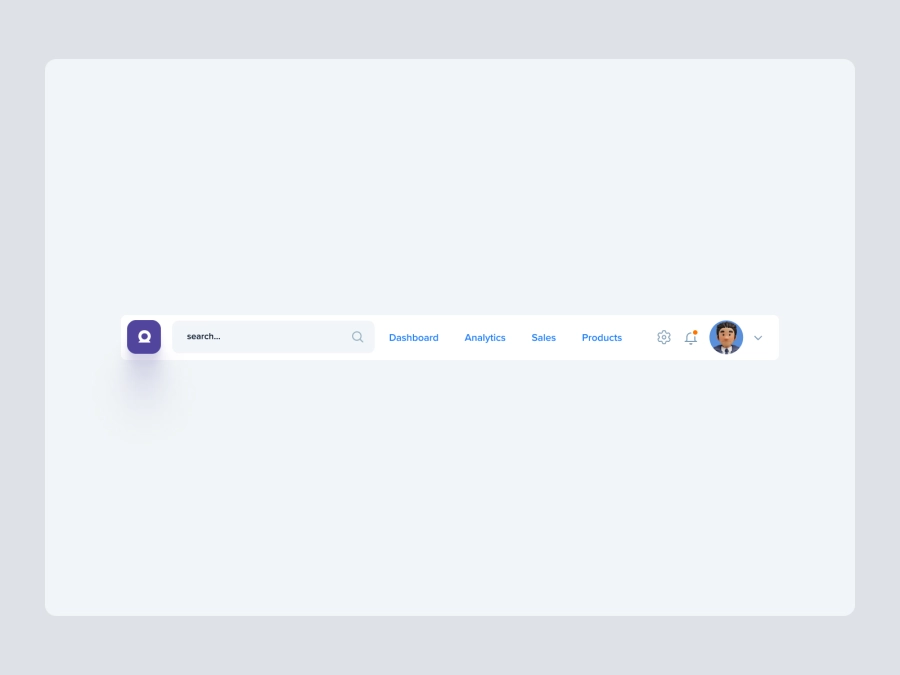
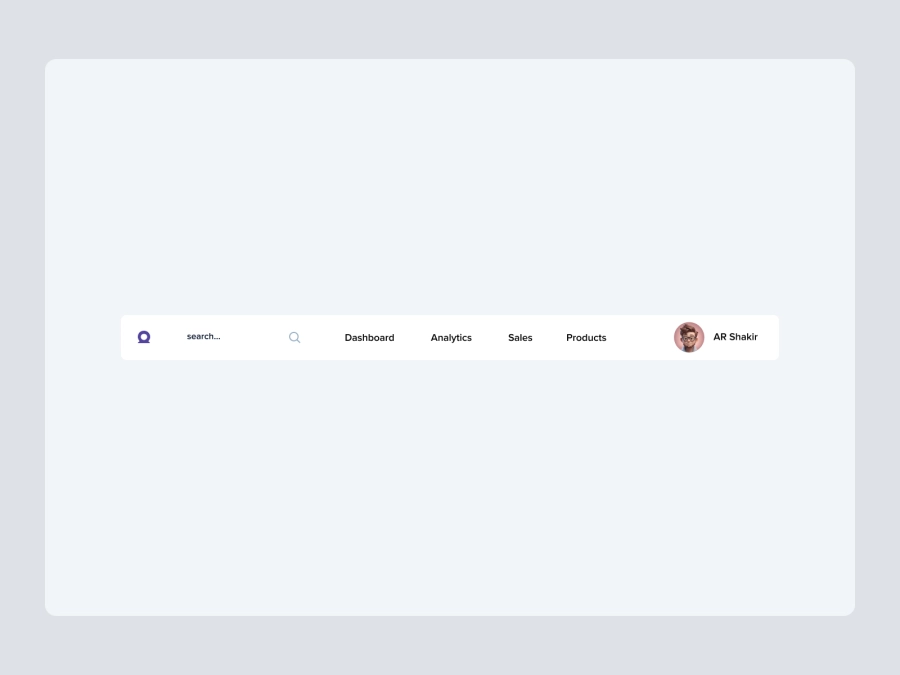
Dashboard Top Nav
425
U
UI Dux
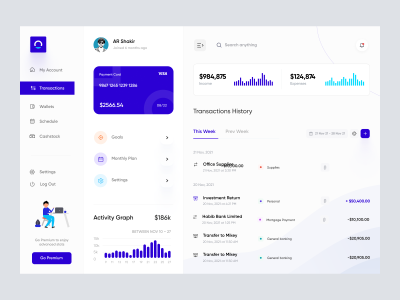
Finance Dashboard UI Concept
953
U
UI Dux
Figma
XD

Finance Dashboard
572
U
UI Dux
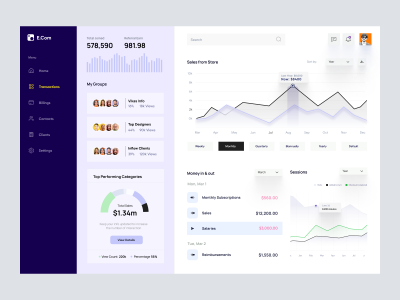
Ecommernce Store Dashboard UI
815
U
UI Dux
Free
Dashboard Top Nav
898
U
UI Dux
Free
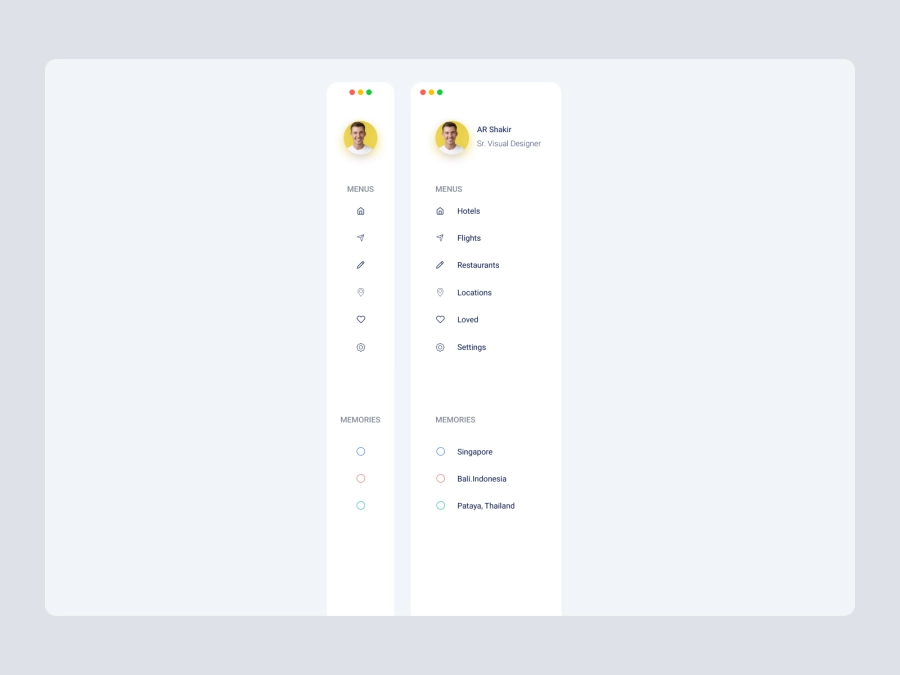
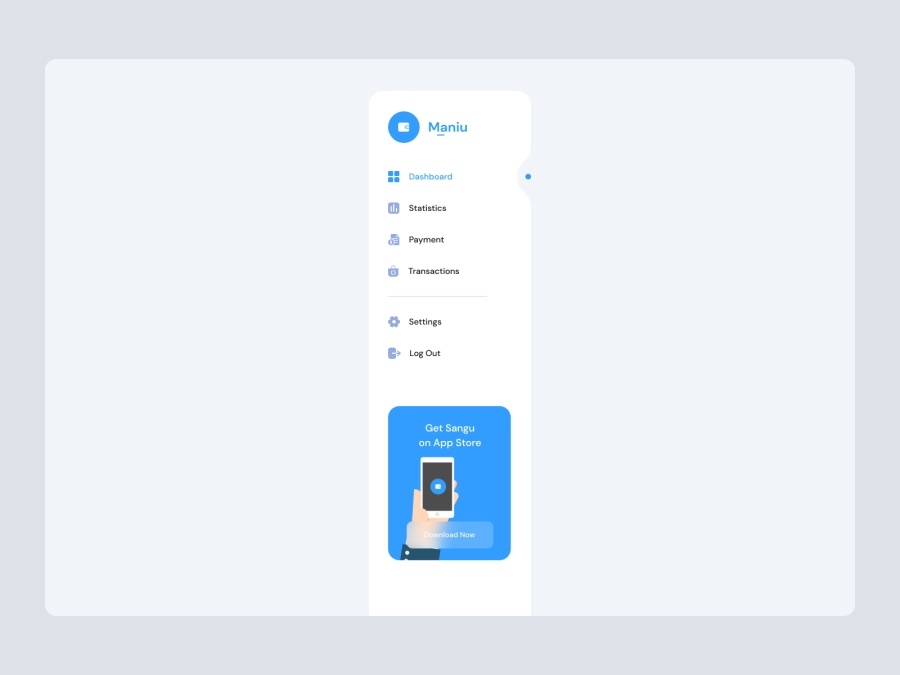
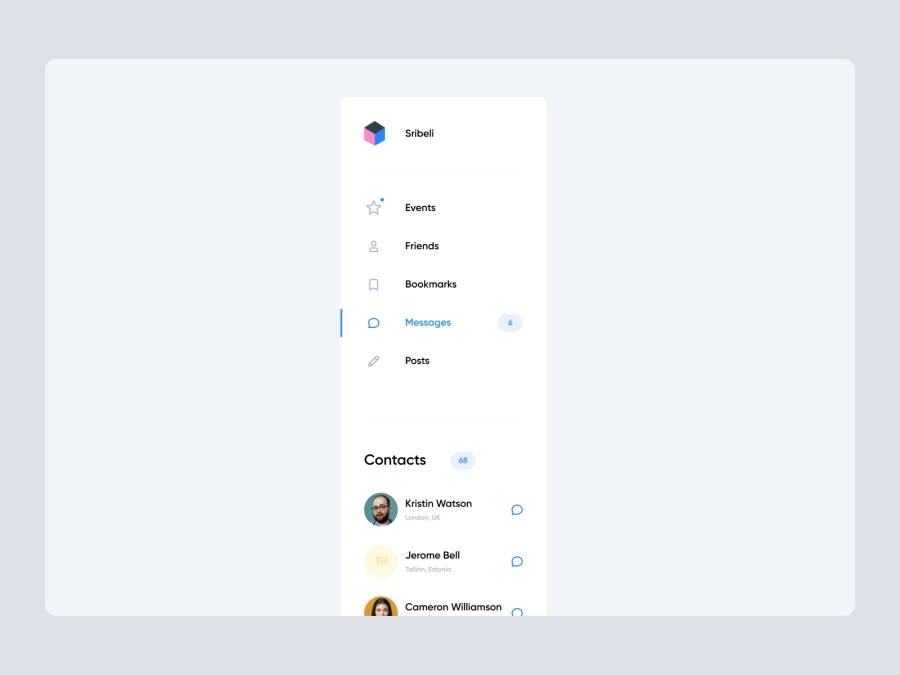
Dashboard Sidebar Navigation
340
U
UI Dux

Ecommerce Store Dashboard
404
U
UI Dux

Growth and Analytics Dashboard UI
686
U
UI Dux
Free
Dashboard Top Nav
696
U
UI Dux
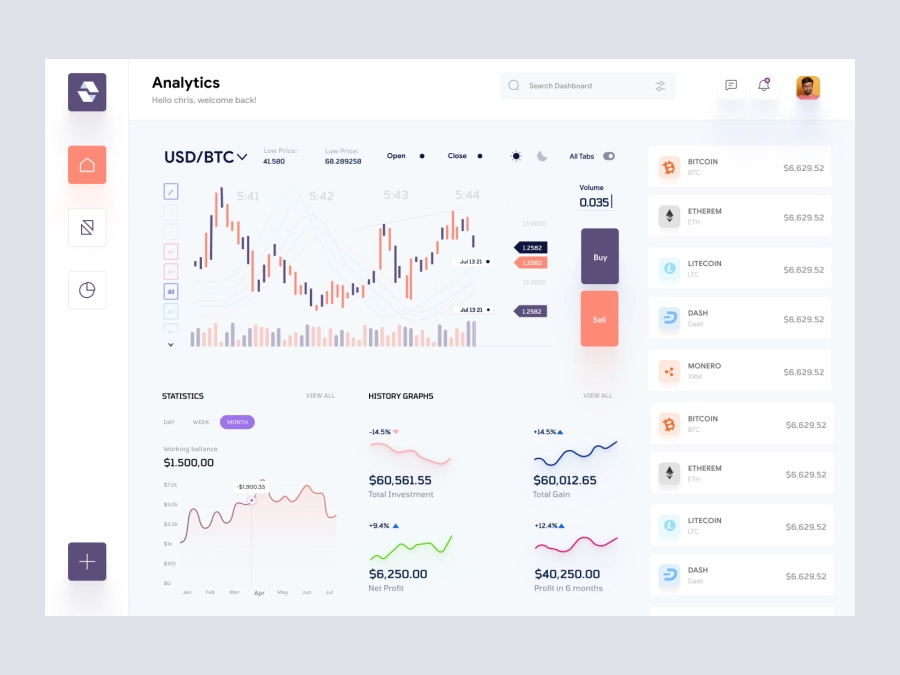
Raone - Cryptocurrency Dashboard UI
670
U
UI Dux
Figma
XD
Free
Dashboard Sidebar Navigation
663
U
UI Dux
Free
Dashboard Sidebar Navigation
651
U
UI Dux
Free
Dashboard Sidebar Navigation
424
U
UI Dux
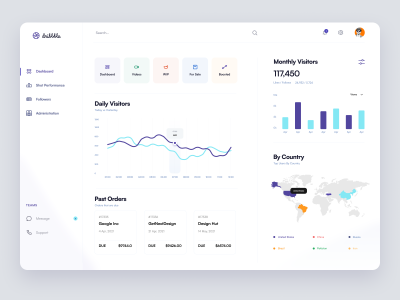
Dribbble Pro Dashboard UI Concept
378
U
UI Dux
Figma
XD