Premium
v1.0
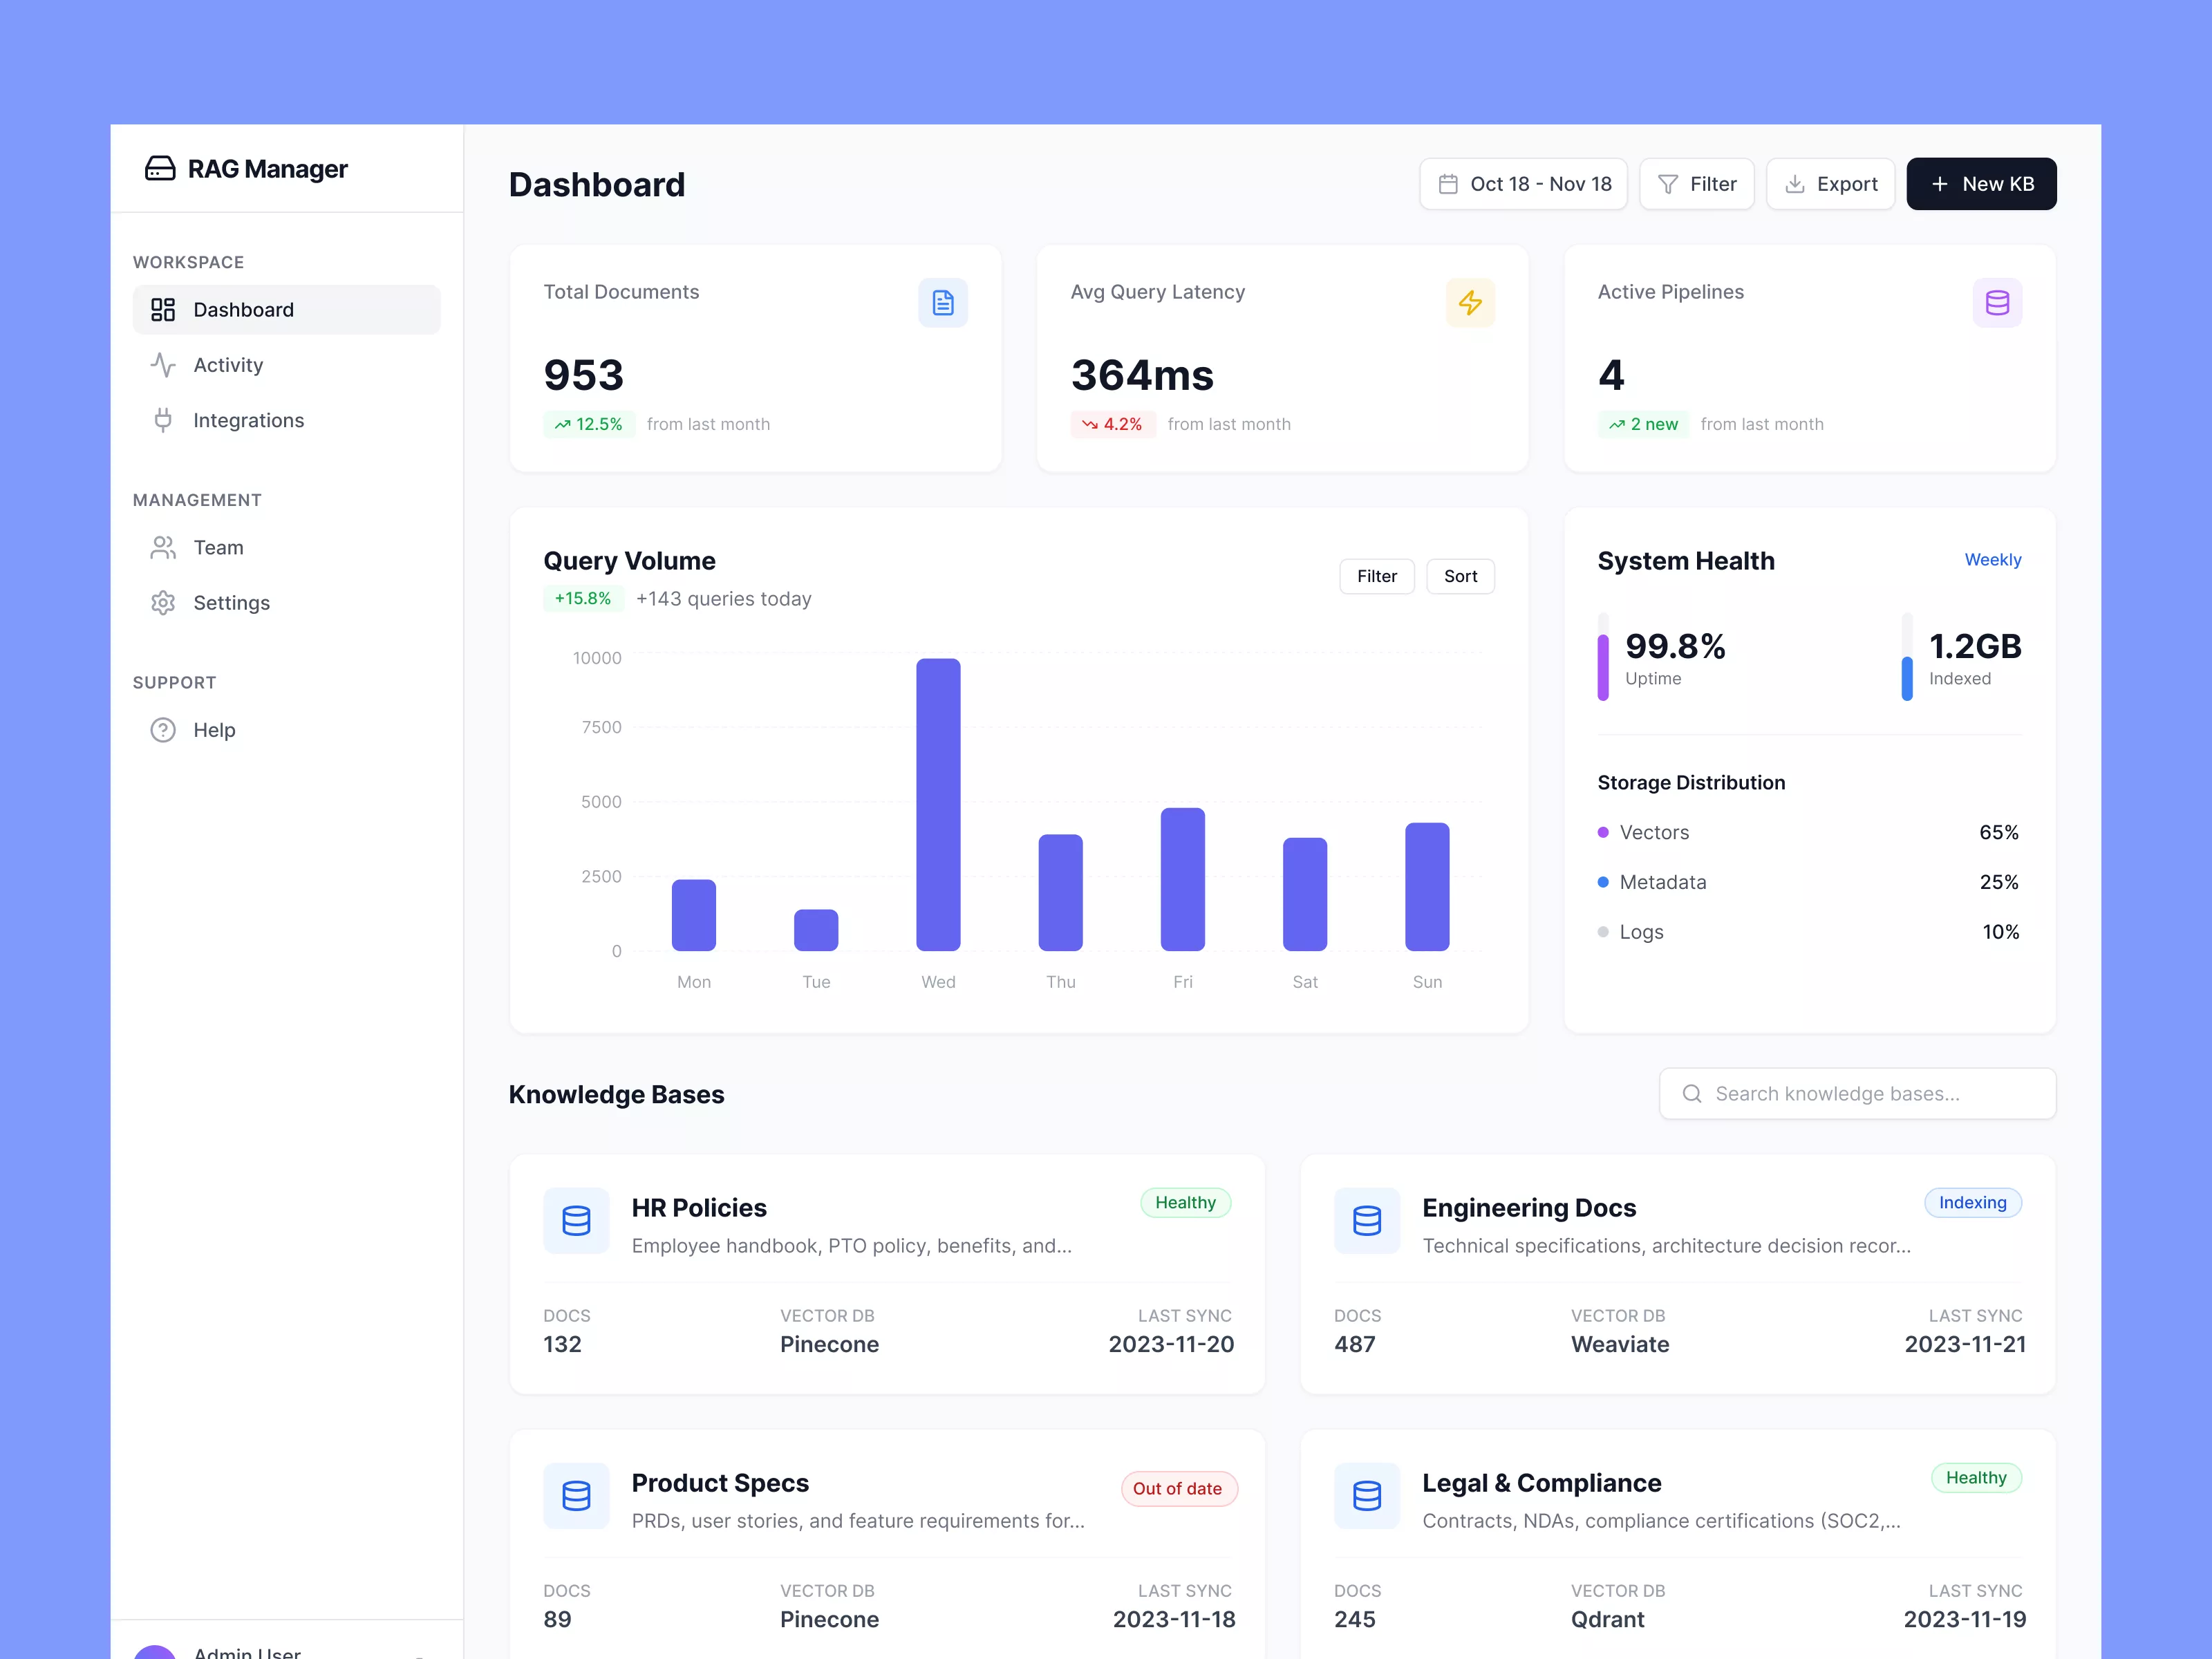
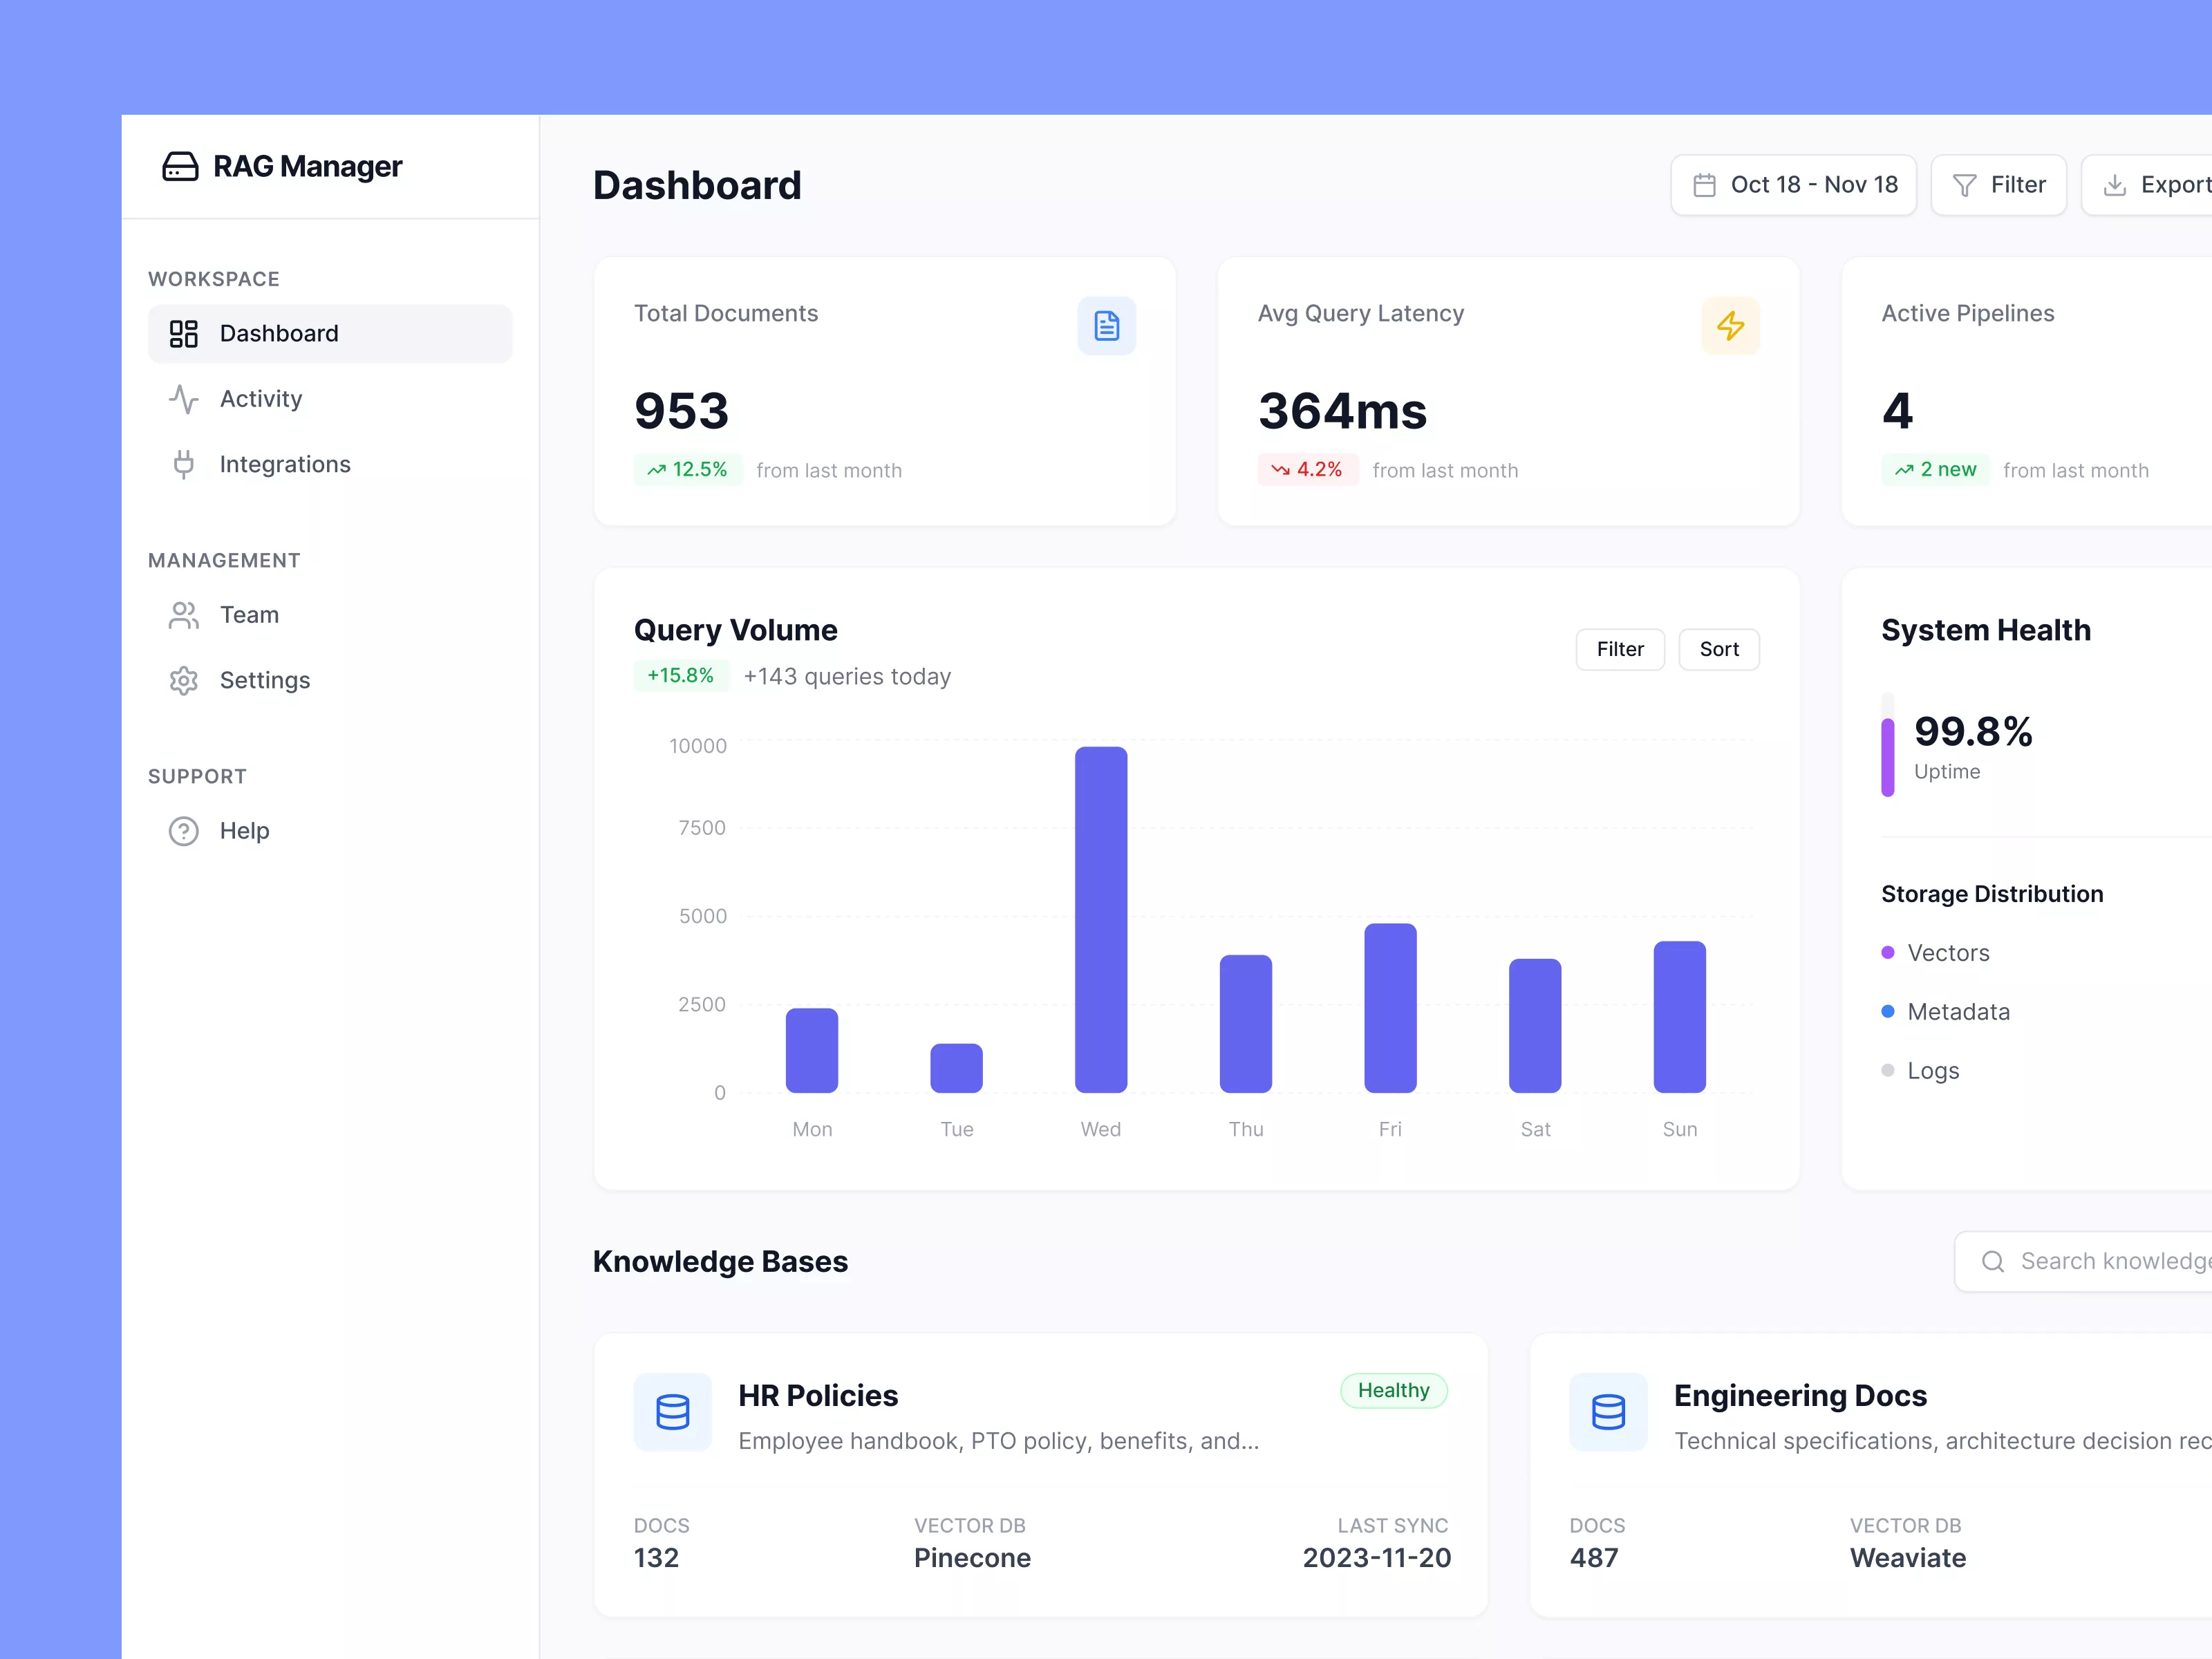
Sleek Dashboard Design for Data Management
A streamlined web application dashboard design showcasing key metrics, system health, and knowledge base statuses. Features intuitive navigation and real-time data insights.

About Sleek Dashboard Design for Data Management
This UI design for a web application dashboard offers a clean and intuitive interface, aimed at providing users with comprehensive insights and easy navigation. The sidebar on the left serves as the primary navigation panel, featuring sections such as Workspace, Management, and Support. The 'Dashboard' tab is currently active, displaying critical metrics in a well-organized grid format in the main section. This includes Total Documents, Average Query Latency, and Active Pipelines, each highlighted with concise statistical data and trend indicators. The central graph dynamically illustrates weekly query volume, enabling users to visually track performance over time. On the right, 'System Health' and 'Storage Distribution' deliver real-time stats on uptime and data usage. Below, a Knowledge Bases section succinctly presents categorized documentation, with indicators for status and last sync dates enhancing the immediacy of information. Overall, this design effectively balances aesthetics and functionality to enhance user experience.
Features
- Intuitive Design
- Real-time Insights
- Comprehensive Metrics
- Dynamic Data Visualization
- Efficient Navigation
- Status Indicators
- Customizable Data Set
- Resource Allocation
Frequently Asked Questions
What does the 'Total Documents' metric indicate?
It shows the total number of documents processed within the system.
How is 'Average Query Latency' measured?
It is calculated based on the average time taken to process queries over the selected date range.
What does 'Active Pipelines' represent?
This metric shows the number of data processing pipelines currently running.
How often is 'System Health' updated?
System Health metrics are updated on a weekly basis to provide real-time performance feedback.
What does 'Storage Distribution' detail?
It displays the distribution of storage usage across Vectors, Metadata, and Logs.
Can I filter data in the 'Query Volume' graph?
Yes, the graph includes options to filter and sort data for custom analysis.
What information do 'Knowledge Bases' provide?
Knowledge Bases list categorized documents, including status and synchronization details.
How is the 'System Uptime' presented?
System Uptime is shown as a percentage representing system availability.
What are the sync statuses for Knowledge Bases?
Statuses such as 'Healthy', 'Indexing', or 'Out of date' indicate current document synchronization.
How do I navigate different sections?
Use the sidebar to switch between Workspace, Management, Support sections.
Premium License
Unknown Size
More like this
View all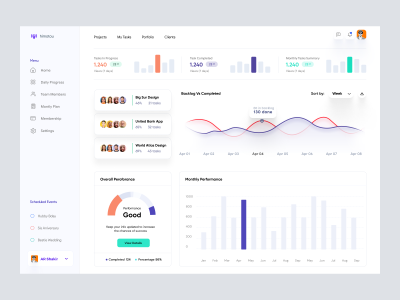
Project Management Dashboard
333
U
UI Dux
Figma
XD

Free
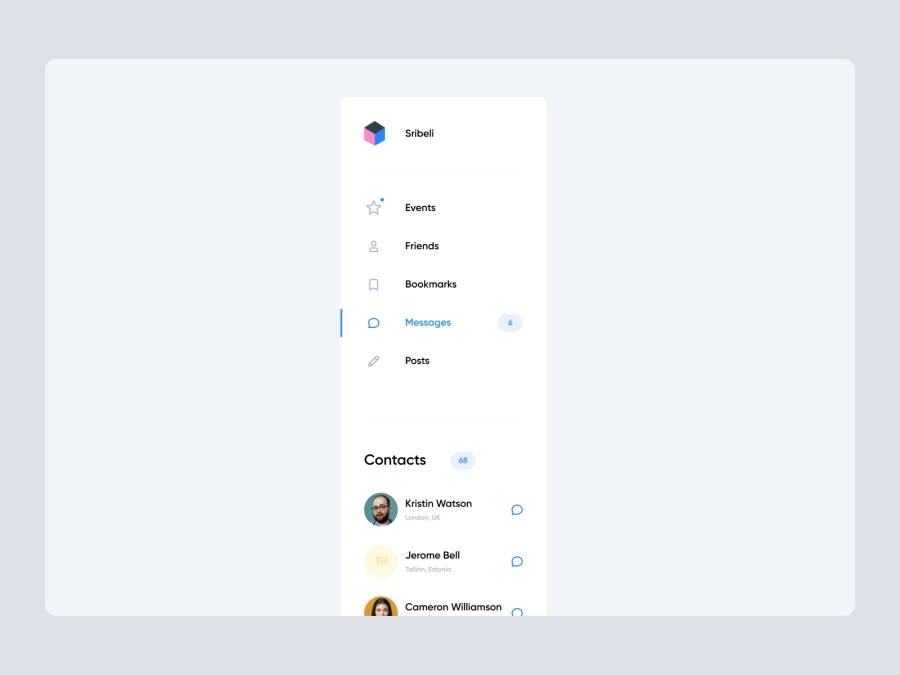
Dashboard Sidebar Navigation
240
U
UI Dux

Ecommerce Store Dashboard
784
U
UI Dux
Free
Dashboard Sidebar Navigation
602
U
UI Dux
Banking Dashboard UI
421
U
UI Dux

Weight Loss Dashboard UI
400
U
UI Dux
Figma
Dashboard UI Concept for a Freelance Designer
376
U
UI Dux
Figma
XD

Free
Dashboard Top Nav
587
U
UI Dux

VitalHealth Dashboard UI for Health Management
568
U
UI Dux
Figma

Cryptocurrency Dashboard UI
428
U
UI Dux
Figma
XD
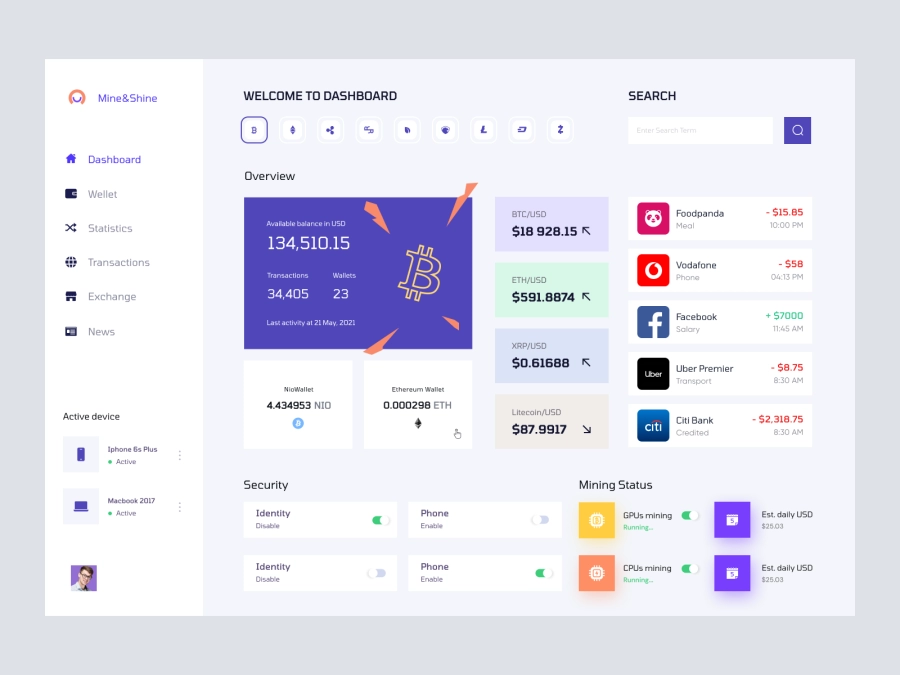
Mine and Shine - Bitcoin Mining Dashboard UI Concept
128
U
UI Dux
Figma
XD

Free
Dashboard Sidebar Navigation
405
U
UI Dux

Banking Dashboard UI Concept
854
U
UI Dux
Figma
XD

Project Management Dashboard UI Concept
134
U
UI Dux
Figma
XD

eLearning Platform Dashboard UI
112
U
UI Dux
Figma
XD