Premium
v1.0
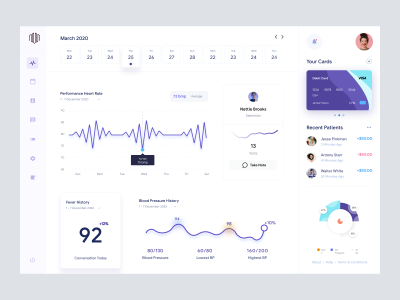
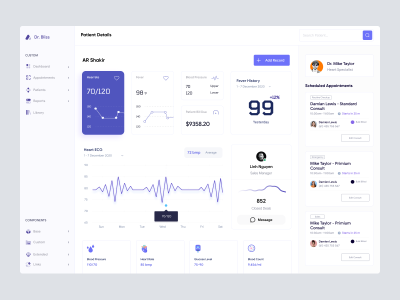
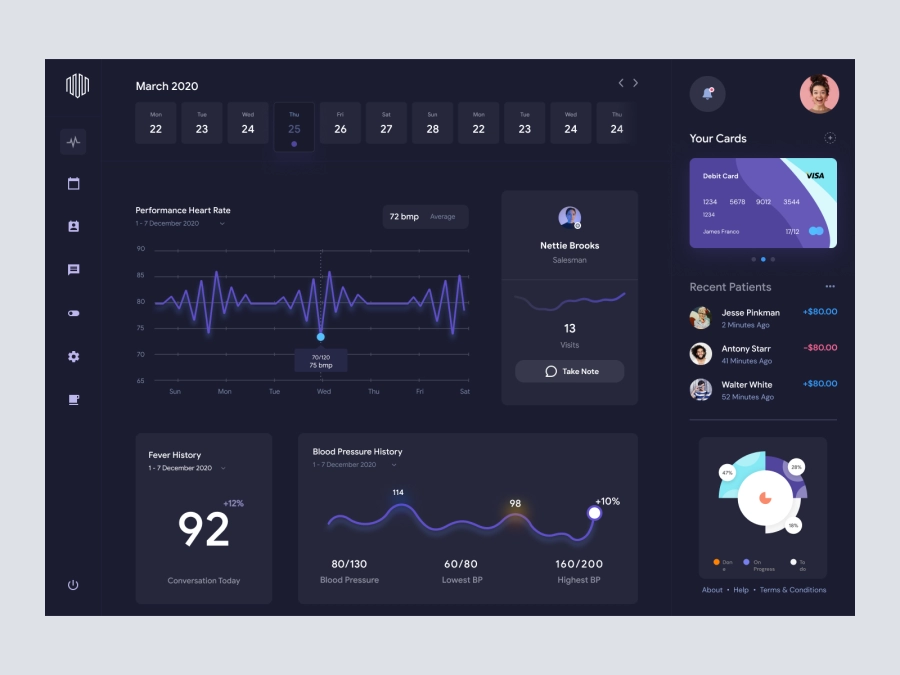
Doctors Dashboard
Enhance your healthcare platform with this sleek, intuitive UI design in Figma, featuring a dashboard for health data visualization and user interaction.

About Doctors Dashboard
Discover our cutting-edge UI design that seamlessly integrates aesthetics with functionality. This unique concept, provided in a Figma file format, is perfect for healthcare platforms, offering a fresh and intuitive user experience. The design is structured with a clean dashboard that includes daily performance heart rate monitoring and insightful visualizations such as line charts for tracking trends over time. With a focus on pastel colors and a minimalist approach, this layout ensures an easy-to-navigate experience for users. Side panels feature interactive elements like user profiles, and financial cards, and track patient visits and health metrics. The dashboard also supports dynamic data with cards for recent patients and financial summaries, all designed to spotlight the critical information at the user's fingertips. Download this adaptable design now to enhance and transform your digital healthcare interactions.
Features
- User-Friendly
- Healthcare Focused
- Customizable
- Dynamic Data
- Interactive Elements
- Comprehensive Dashboard
- Collaboration Ready
- Responsive Design
Frequently Asked Questions
What format is this design available in?
The design is available in a Figma file format.
Can I copy elements directly into Figma?
Yes, you can copy and paste elements directly into Figma.
Is this design focused on healthcare?
Yes, it is designed with healthcare dashboards in mind.
What data can be visualized with this design?
You can visualize performance heart rates, blood pressure history, and recent patient data.
Is this design responsive?
Yes, the design is adaptable to various screen sizes.
Can I customize the colors used in this design?
Yes, colors can be easily customized to fit your brand.
Does this design include user profile features?
Yes, there is an area dedicated to user profiles and details.
Are the charts interactive?
The charts are designed to be interactive for better data insights.
Is this suitable for mobile apps?
While optimized for web, elements can be adapted for mobile.
Does it include financial data visualization?
Yes, the design includes elements for financial summaries.
Premium License
Unknown Size
More like this
View all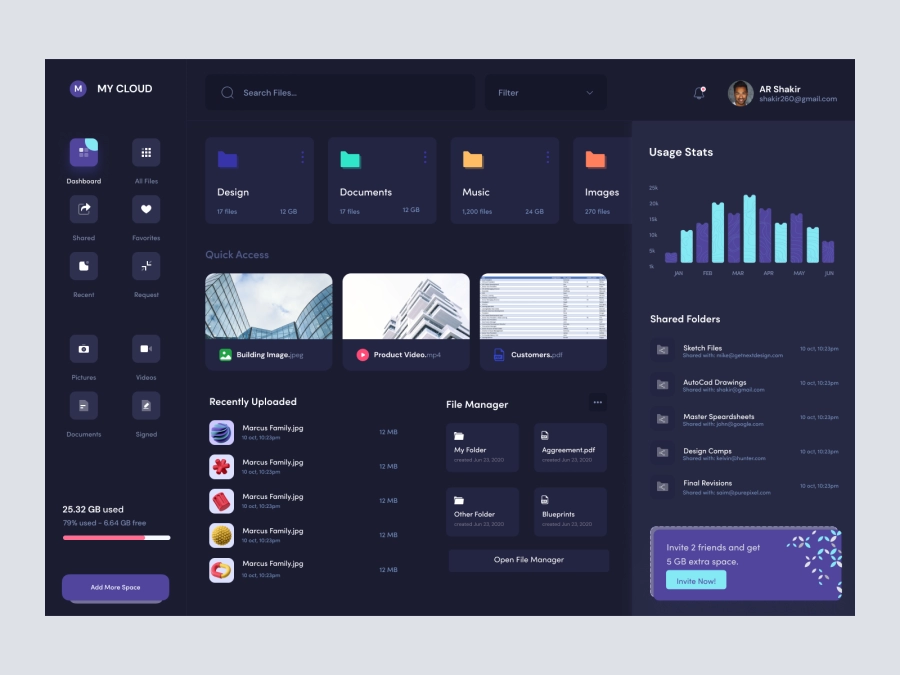
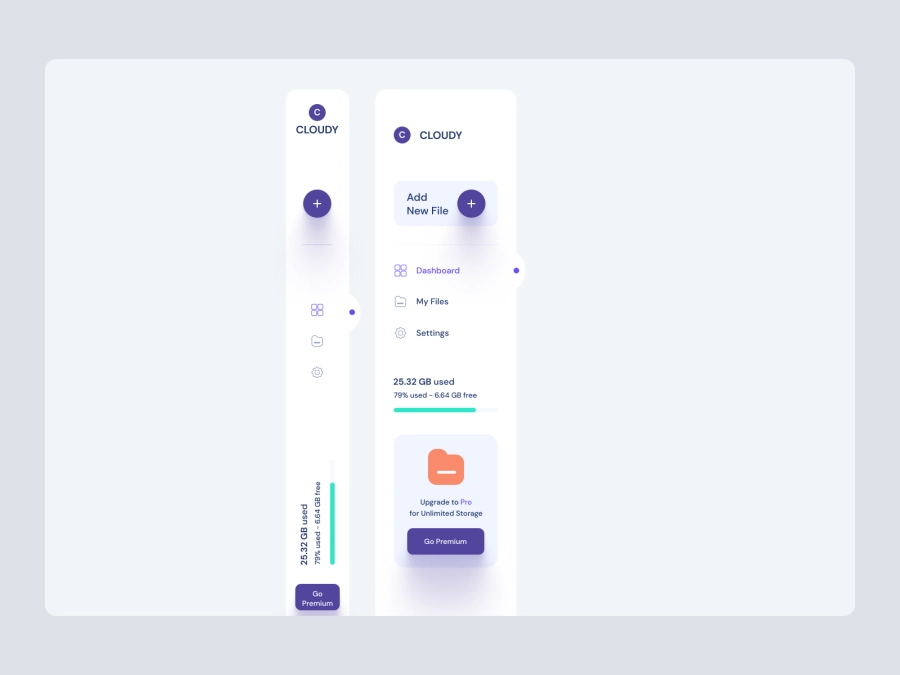
MyCloud - Dashboard UI For Cloud File Storage Dark UI
237
U
UI Dux
Figma
XD
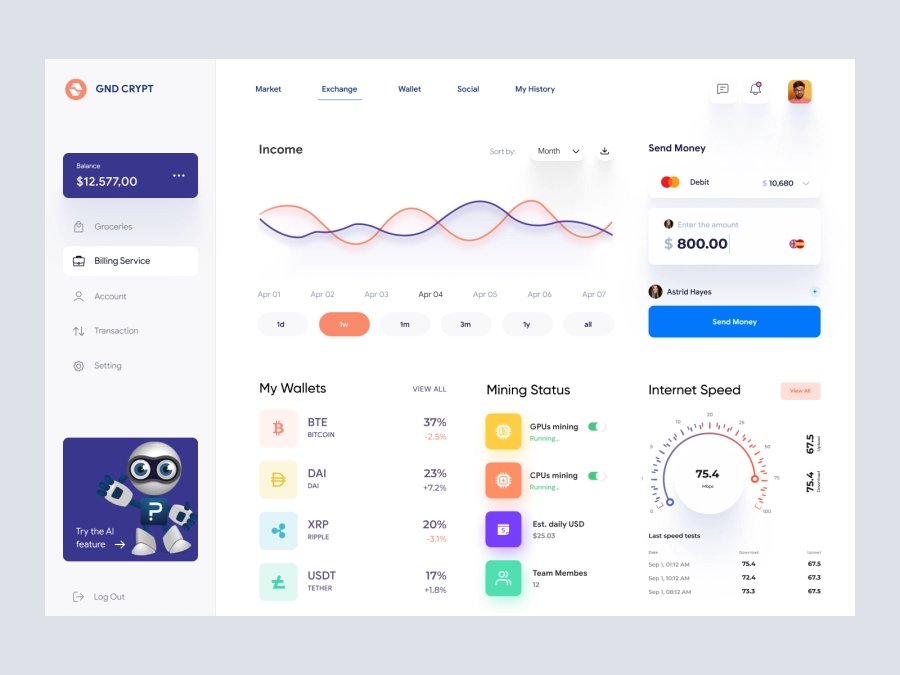
Command CRYPT - Cryptocurrency Dashboard UI
164
U
UI Dux
Figma
XD
Free
Dashboard Top Nav
993
U
UI Dux
Patient Management Dashboard UI
527
U
UI Dux
Figma
XD
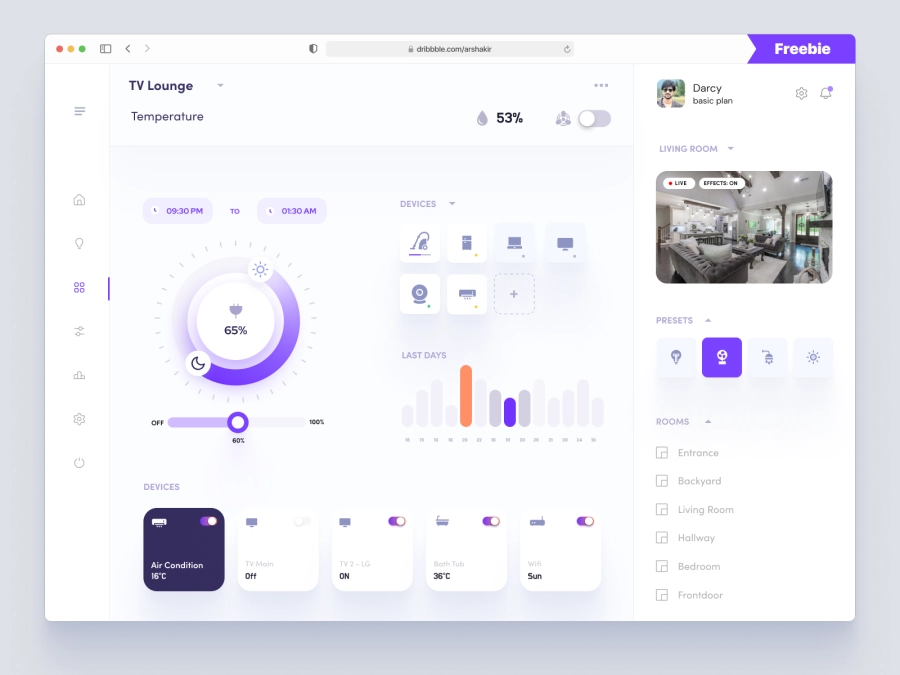
Darcy - Smart Home Management Dashboard
467
U
UI Dux
Figma
XD
PixelPay - Banking Dashboard UI Dark Version
666
U
UI Dux
Figma
XD

Crypto Dashboard UI
917
U
UI Dux
Figma
XD

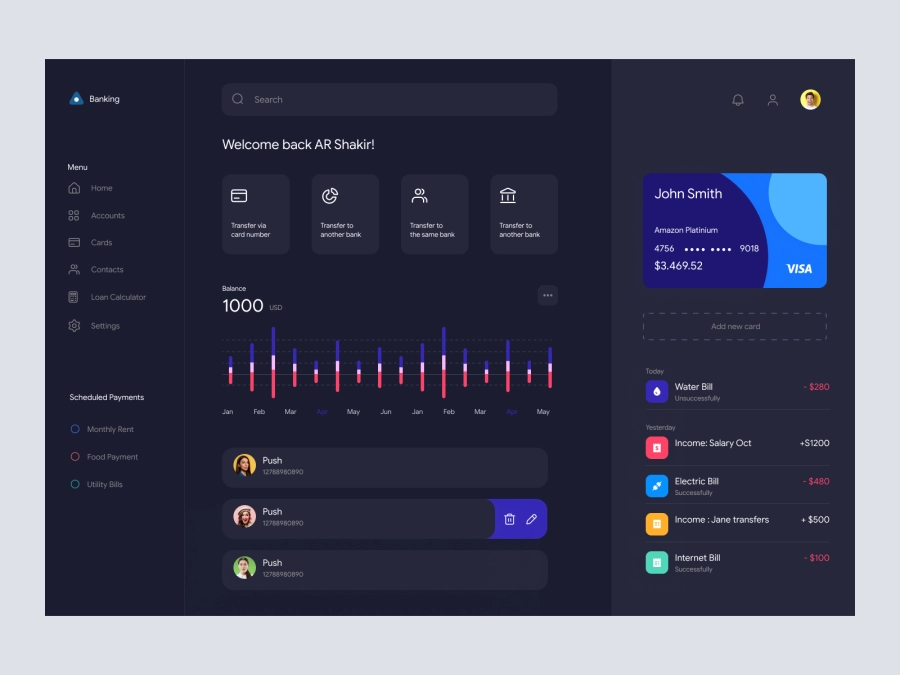
Banking Dashboard UI
182
U
UI Dux
Figma
XD
Free
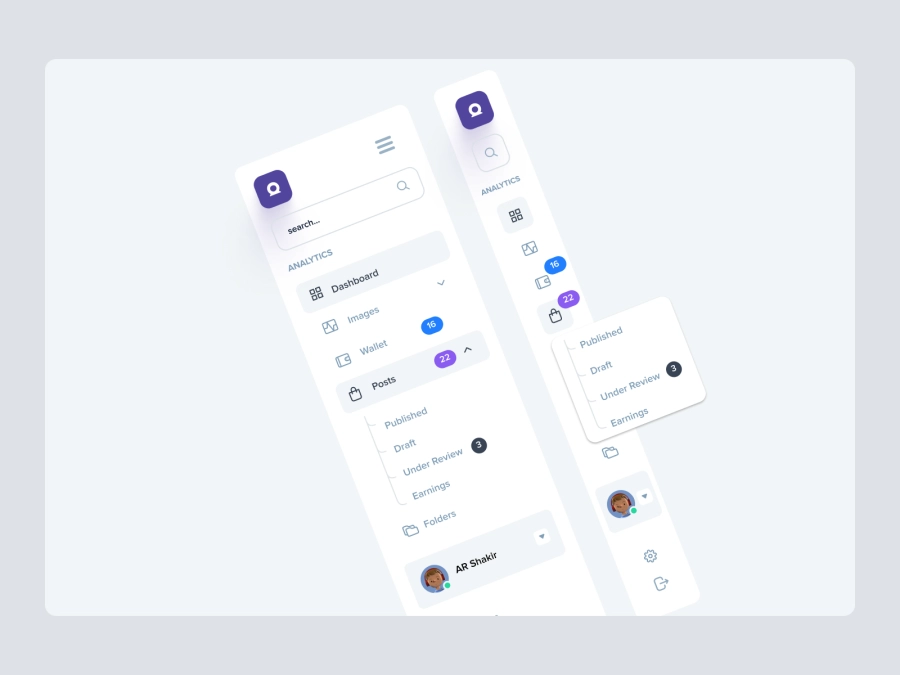
Dashboard Sidebar Navigation
979
U
UI Dux
Free
Dashboard Top Nav
802
U
UI Dux

06 - Cryptocurrency Dashboard UI Concept
984
U
UI Dux
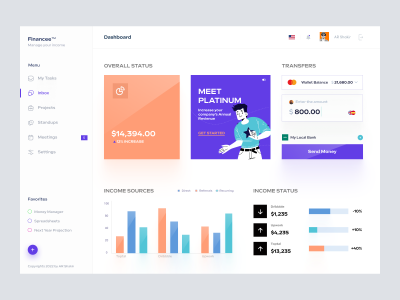
Freelancer Finance Dashboard
780
U
UI Dux
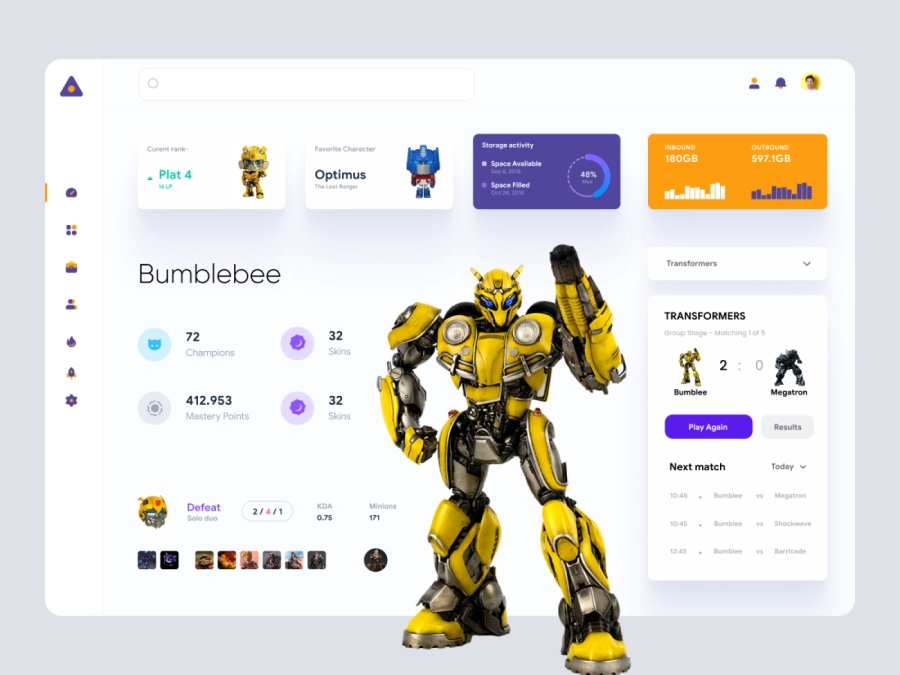
Khaal Drogo - Gaming Dashboard UI Concept
225
U
UI Dux
Figma
XD
Dr.Du - Doctors Dashboard
620
U
UI Dux
Figma
XD
Bangroo - Daily Tasks Management Dashboard
647
U
UI Dux
Figma
XD